Issues in Limited-Area Ensemble Forecasting
NOAA Earth System Research Laboratory. Issues in Limited-Area Ensemble Forecasting. Tom Hamill NOAA Earth System Research Lab tom.hamill@noaa.gov. 1. What is limited-area ensemble forecasting?. Ensemble of forecasts computed with limited-area model.

Issues in Limited-Area Ensemble Forecasting
E N D
Presentation Transcript
NOAA Earth System Research Laboratory Issues in Limited-Area Ensemble Forecasting Tom Hamill NOAA Earth System Research Lab tom.hamill@noaa.gov 1
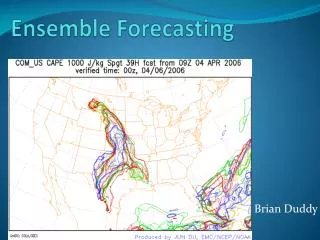
What is limited-area ensemble forecasting? Ensemble of forecasts computed with limited-area model. Typically, an ensemble of lateral boundary conditions are supplied by a global ensemble forecast system, though sometimes they are perturbed with random noise. They may have multiple nested domains, as is the example from Cliff Mass’ U. Washington ensemble forecast system. Members may use different forecast models, or physical parameterizations, as in NCEP’s SREF system. 2 from Grimit and Mass, Wea & Forecasting, April 2002
The potential of limited-area, short-range ensemble forecasting (LAEF) Simulated reflectivity from LAEFs used in US NWS Storm Prediction Center’s 2007 “Spring Experiment”. Observed nicely bracketed by ensemble, simulations suggest rotating severe thunderstorms of type that may spawn tornadoes. And … (next slide) yellow = radar observed > 40 dBZ 3 c/o Steve Weiss, Jack Kain, many others; see http://hwt.nssl.noaa.gov/Spring_2007/loops/wrfs/
Indeed, there were tornadoes in region of LAEF’s supercells. 4
Potential of LAEF’s continued Heavy rainfall event in Sardinia, 12-13 Nov 1999 Analyzed LAEF: 51-member ensemble, ~ 22-km grid spacing. Domain 29º-56º N, 19ºW - 31ºE. ECMWF EPS @T255 (~80 km grid spacing). ECMWF forecasts miss heavy precipitation event, LAEF does much better. 5 from Chessa et al., Wea. & Forecasting, June 2004.
Comparison of ensemble-mean performance (NCEP SREF vs. GEFS) GFS ensemble (T126L28, approximately 100-150 km grid spacing) vs. LAEF (“SREF”) system (~40 km) Results c/o Jun Du, NCEP/EMC 6
Rank histograms (NCEP SREF vs. GEFS) 63-h fcst Results c/o Jun Du, NCEP/EMC 7
Reliability diagrams (45-h NCEP SREF vs. GEFS) c/o Jun Du, NCEP/EMC 8
Norway’s LAEF and precipitation forecast ROC, 20 mm/ 24 h ROC, 30 mm/ 24 h ECMWF SREF a = SREF domain b = TESV domain d = precip. verification area ECMWF model at T159L31; SREF at ~ 28 km. Better precipitation forecasts in the complex terrain of Scandanavia for 5 winter cases. 9 Ref: Frogner et al., QJRMS, 2002
However: difficulties of some LAEFs to outperform a global EPS Comparison of ECMWF global ensemble vs. European domain LAEFs, ~20-km grid spacing. Verification statistics over 21 summer cases from 2007; targeted singular vectors from European domain used for initial conditions. For some variables not so much affected by terrain, it’s tough to beat global EPS at high resolution. ECMWF, 50 mbr ECMWF, 20 mbr European TEPS, 20 mbr Norwegian TEPS, 20 mbr 10 from Trond Iversen ECMWF presentation, at http://www.ecmwf.int/newsevents/meetings/workshops/2007/ensemble_prediction/presentations/iversen.pdf
Difficulties, continued. Precipitation forecasts ECMWF EPS = ECMWF operational, T255 (~60 km) TEPS = ECMWF with targeted singular vectors for Europe LAMEPS = Norway’s HIRLAM 28-km LAEF system. NORLAMEPS = LAMEPS + TEPS Verifying over winter and summer cases in Scandanavia, ECMWF EPS has the most skill. ECMWF tougher reference than in 2002 study. 11 from Frogner et al, (2006), QJRMS, p. 2785.
Questions • What are unique sources of errors in LAEFs compared to global ensemble prediction systems? • What are the underlying reasons why LAEFs are useful in some situations and not as useful in others? • What adjustments can be made to the manner in which LAEFs are calculated to improve them? • If LAEFs aren’t uniformly beneficial, in what particular applications and meteorological situations should we use them? 12
Lateral boundary conditions(now universally accepted that perturbed LBCs necessary in LAEFs) Example: SREF Z500 spread for a 19 May 98 case of 5-member, 32-km Eta model ensemble. (only small impact on precipitation field) Ref: Du and Tracton, 1999, WMO report for WGNE. 0-h 12-h 24-h 36-h Perturb both IC & LBC Perturb LBC only Perturb IC only 13
Lateral boundary condition issues for LAMs (and LAEFs) • With 1-way LBCs, small scales in domain cannot interact with scales larger than some limit defined by domain size. • LBCs generally provided by coarser-resolution forecast models, and this “sweeps” in low-resolution information, sweeps out developing high-resolution information. • Physical process parameterizations for model driving LBCs may be different than for interior. Can cause spurious gradients • LBC info may introduce erroneous information for other reasons, e.g., model numerics. • LBC initialization can produce transient gravity-inertia modes. 14 Ref: Warner et al. review article, BAMS, November 1997
Influence of domain size T-126 global model driving lateral boundary conditions for nests with 80-km and 40-km grid spacing of limited-area model. from Warner et al. Nov 1997 BAMS, and Treadon and Peterson (1993), Preprints, 13th Conf. on Weather Analysis and Forecasting 15
Influence of domain size, continued large nested domain small nested domain 40-km nested domain in global model had thin, realistic jet streak using large domain (left) and smeared-out, unrealistic jet streak using small domain (right). High resolution of interior domain not useful here because of sweeping in of low-resolution information. 16 Ref: ibid
Small domains and short-circuiting scale interactivity: an example ofLAEF bad practices SLP analyses SREF domains 0900 30 August 1996 2100 30 August 1996 Leslie and Speer 1998 WAF article, “Short-Range Ensemble Forecasting of Explosive Australian East Coast Cyclogenesis” Small-domain, 100-member LAEF used to estimate predictability of cyclone with damaging winds. Random noise at each grid point used to initialize ensemble. 0900 31 August 1996 2100 31 August 1996 17
Distribution of winds and rainfall for grid point closest to Sydney during storm The large percentage of ensemble members with high winds and heavy rain was used to justify the conclusion that forecasters could be highly confident of a damaging event. But the method of ensemble construction and the small domain size may have limited the ensemble dispersion artificially. Also, no a priori demonstration that ensemble was properly spanning range of events (rank histograms). 18
Problems caused by using outer domain convective parameterization with explicit convection in nest Simulation of nested domains, explicitly resolved convection on inner (3.3 km grid spacing, various parameterized convection on outer (10, 30 km). Rainfall on inner domain affected by choice of what is done on outer domain. E123 is explicit on each domain, KF12E3 is Kain-Fritsch on 1&2, explicit on 3. 19 Warner and Hsu, MWR, July 2000
Problems caused by using outer domain convective parameterization with explicit convection in nest In comparison with a dry simulation, the effect of parameterized convection on the thermodynamics of the interior grid is to heat the upper troposphere and dry the middle troposphere. Lessons: If possible, use large convectively resolving domains. Develop/utilize convective parameterizations with physically reasonable mass-field responses. Develop ways of tuning convective parameterizations to minimize nonphysical competition between explicit and parameterized convection. 20
Paul Nutter’ et al.’s experiments with nested ensemble forecasts Experiments using modified barotropic channel model with smaller interior domains. 25-km grid spacing. Coarser resolution of driving model for LBC’s simulated by filtering. 21 from Nutter et al., Oct. 2004 MWR
Nutter et al.’s experiments, cont’d. Simulating the effects of initializing high-resolution interior domain with coarse resolution analysis. Here, as a baseline, the model forecasts throughout the full channel are cycled for a while at high resolution. The variance spectra in the M domain is calculated (“global”). The simulation is then repeated, but initial and LBC information provided to the M domain is filtered to remove scales below 150 km, simulating initialization with a coarse-resolution analysis and coarse-resolution information from LBCs. Variance spectra in M domain is recalculated (“LAM”). Ratio of the filtered/unfiltered in LAM is plotted. The small grid spacing on the interior is useless at first, inheriting global ensembles without small scales. Even after a long time, there is not much variance at the small scales that develops due to the higher interior resolution. The extra resolution is largely wasted. Variance ratio (LAM/global) Variance ratio (LAM/global) 22
Nutter et al.’s experiments, cont’d. Variance ratio (LAM/global) Here the initial condition does initially contain all scales of motion, but M domain thereafter receives filtered lateral boundary conditions. Even with a quality initialization, the small scales are “swept” away with time by the lower-resolution information coming in from the LBC’s. t=0 Variance ratio (LAM/global) 23
Nutter et al.’s experiments, cont’d.Effects of using linear temporal interpolation with 3-hourly boundary conditions Sc domain. Here interior, exterior resolutions are the same, but correct LBC’s are used only every third hour, and otherwise interpolated, as is commonly practiced. Shading is vorticity error, contours are streamfunction error. Notice pulsing of errors, reduced on boundaries at 0, 3, 6, 9, but larger at in- between times. However, errors generally grow as a result of temporal interpolation. 24
Option: driving LBCs withrandom (correlated) noise • If your LAEF has its own cycled analysis system, you can divorce from global models by using random noise on LBCs • Ref: Torn et al., MWR, Sep. 2006 25
Initial-condition issues in LAEFs Theory says: perturbations sample distribution of analysis errors. Short-range forecast: forecast spread and structure related to what’s in analysis. Long leads: Perturbation structure defined by chaotic error growth particular to that weather situation (+LBCs in LAEFs). How ensemble is initialized may matter much more for LAEFs than for medium-range EFs. What are the characteristics of this analysis uncertainty? What initialization issues are unique to LAEFs vs. global models? 26
Monte-Carlo experiments can tell us about some properties of initial condition errors 27 from Hamill et al., MWR, Nov. 2002
Some properties of analysis errors more observations, less analysis error, and less spatial & temporal variation of errors. analysis errors tend to be larger near model bottom and top, less in the middle. (See also Hollingsworth and Lonnberg, 1986, Tellus, and Hakim, MWR, March 2005) 28
Some properties of analysis errors First-guess errors tend, via chaotic-error growth in preferential directions, to have significant dynamical structure, like baroclinic tilt shown here. The analysis randomizes the characteristics of the errors. 29
analysis spectrum Properties of analysis errors 72h 12h Analysis errors tend to have a white spectrum and are a larger fraction of the climatological variance at small scales than at large scales. Still, there is more total error in the large scales than in the small scales. analysis error spectrum Ref: Hakim, MWR, March 2005 30
Initial-condition uncertainty: properly represented in LAEFs? Property of singular vectors sized initial time (dashed) and 48 h later (solid). Main point: analysis errors may not be like total-energy singular vectors. TESVs have large amplitude in mid-troposphere, much more power at small scales than analysis errors, this suggests. Grow less rapidly. Potential danger of using ICs from global, medium- range EF systems, not optimized for providing high-quality ensembles at short leads. Analysis-error covariance singular vectors Total-energy singular vectors 48-h evolved *10 initial*10 *10 *10 31 from Barkmeijer et al., QJRMS, 1999
Initializing with analyses and perturbations from a global model • (1) LAEF model may have different bias characteristics from global model. • Analyses inherits first-guess model biases in data-sparse areas • Period of adjustment to be expected as Bias(global forecast) Bias(LAEF). • (2) Large-scale model analyses may lack sufficient detail appropriate to mesoscale LAEF initialization. 32
= .995, difference in January 2004analysis climatology, NCEP’s current analysis system(T62) - CDAS (~NCEP-NCAR reanalysis).Very large differences, due to land-surface treatment and terrain differences in models with different resolutions. Included here to point out that a LAEF system may have its own preferred systematic model error, and if initialized from global analysis system with different systematic errors, there may be a transient period of adjustment. 33 ref: J. Whitaker, personal communication
Sampling analysis uncertainty at mesoscale? Small-scale details in wind field seem reasonable given satellite imagery, not in single smooth analysis. But shouldn’t ensemble of analyses have range of small-scale features? 34 Ref: ruc.noaa.gov
Model error at mesoscale:(1) errors from insufficient grid spacing • George Bryan (NCAR) tested convection in simple models with grid spacings from 8 km to 125 m Ref: http://www.mmm.ucar.edu/people/bryan/Presentations/bryan_2007_nssl_resolution.pdf
4 km, 1 km, 0.25 km • Across the squall line vertical cross section for 25 ms-1 wind shear. Shading: mixing ratio (g kg-1); contours (vertical velocity (every 4 ms-1). • Dramatic changes in structure of squall line, updraft, positioning of cold pool. Ref: http://www.mmm.ucar.edu/people/bryan/Presentations/bryan_2007_nssl_resolution.pdf
4 km, 1 km, 0.25 km • Along the squall line vertical cross section for 20 ms-1 wind shear. Shading: mixing ratio (g kg-1); contours (vertical velocity (every 4 ms-1). • Updrafts increase in number and intensity with increasing resolution, decrease in size. Ref: http://www.mmm.ucar.edu/people/bryan/Presentations/bryan_2007_nssl_resolution.pdf
4 km, 1 km, 0.25 km • Plan view and N-S integrated vertical cross section for 25 ms-1 wind shear. Shading: mixing ratio (g kg-1); contours (vertical velocity (every 4 ms-1). • Here, 1 km and 4 km differences aren’t as noticeable. Ref: http://www.mmm.ucar.edu/people/bryan/Presentations/bryan_2007_nssl_resolution.pdf
4 km, 1 km, 0.25 km • System propagation approximately converged at 1 km for high-shear cases. • For low-shear environment (more weakly forced) resolutions above 1 km are increasingly inadequate. Ref: http://www.mmm.ucar.edu/people/bryan/Presentations/bryan_2007_nssl_resolution.pdf
Model errors at mesoscale: (2) those darn parameterizations! • Land-surface parameterization • Boundary-layer parameterization • Convective parameterization • Microphysical parameterization • etc.
Model error at mesoscale:Example: cloud microphysical processes Conversion processes, like snow to graupel conversion by riming, are very difficult to parameterize but very important in convective clouds. Especially for snow and graupel the particle properties like particle density and fall speeds are important parameters. The assumption of a constant particle density is questionable. Aggregation processes assume certain collision and sticking efficiencies, which are not well known. Most schemes do not include hail processes like wet growth, partial melting or shedding (or only very simple parameterizations). The so-called ice multiplication (or Hallet-Mossop process) may be very important, but is still not well understood from Axel Seifert presentation to NCAR ASP summer colloquium
Model error at mesoscale:Summary of microphysical issuesin convection-resolving NWP • Many fundamental problems in cloud microphysics are still unsolved. • The lack of in-situ observations makes any progress very slow and difficult. • Most of the current parameterization have been designed, operationally applied and tested for stratiform precipitation only. • Most of the empirical relations used in the parameterizations are based on surface observation or measurements in stratiform cloud (or storm anvils, stratiform regions). • Many basic parameterization assumptions, like N0=const., are at least questionable in convective clouds. • Many processes which are currently neglected, or not well represented, may become important in deep convection (shedding, collisional breakup, ...). • One-moment schemes might be insufficient to describe the variability of the size distributions in convective clouds. • Two-moment schemes haven‘t been used long enough to make any conclusions. • Spectral methods are overwhelmingly complicated and computationally expensive. Nevertheless, they suffer from our lack of understanding of the fundamental processes. from Axel Seifert presentation to NCAR ASP summer colloquium
Effect of assumed graupel density and particle size distribution, i.e. size and fall speed, in a storm split spawning supercells. Contours: rain isohyets: shading: hail/graupel depths greater than .01, 0.1, 1, and 10 mm. • : location of maximum graupel accumulation. : location of maximum hail accumulation. Plausible changes in microphysical parameterizations can cause large changes in precipitation amount, type, and location. Sensitivity of deep convective storms to graupel properties in a microphysical parameterization Ref: Gilmore et al., Nov 2004 MWR
Perturb the land surface in LAEFs? The land state can be thought of as part of the initial condition. Why not perturb it? Perturbing the soil moisture (here, WRF initialized with 2 different soil moisture analyses) increased warm-season precipitation forecast spread, modulated the details of thunderstorm activity. Likely to have biggest impact in warm season, when insolation is large. Though In winter, perturb snow cover/depth? 44 Ref: Sutton et al. MWR, Nov 2006
Resolution / ensemble size Day 5: 1-mm threshold Day 5: 10-mm threshold Why more members with less resolution may be better. Results with ECMWF global model. Potential economic value relative to deterministic forecast. At 50 mm, large ensemble from lower-resolution models provides more skill than smaller ensemble at higher resolution. Probabilities of rare events estimated better. Day 5: 20-mm threshold Day 5: 50-mm threshold Fig. 15. Cost/loss value curves at day 5 for the 16 auxiliary cases (8 summer and 8 winter), verified on the 1.25° × 1.25° uniform grid. Legend: T159 with 51 members (solid black); T255 with 51 members (solid gray); T319 with 51 members (dashed gray); T255 with 15 members, equivalent computational cost as T159 with 51 members (black with gray diamonds); T319 with 15 members, equivalent computational cost as T255 with 51 members (gray with black diamonds); megaensemble composed of T159 and T255 ensembles with 102 members but lower computational cost than T319 with 51 members (dashed black). (a) The 1-mm threshold, (b) 10-mm threshold, (c) 20-mm threshold, and (d) 50-mm threshold. Negative values are not shown. 45 Ref: Buizza, ECMWF
Warm season Cool season Resolution / ensemble size:forecast precipitation climatology as f(resolution) • Why fewer members at higher resolution may be better. • MM5 model with 40-km and 13-km grid spacings, NCEP-NCAR reanalysis LBCs. • Lesson: raw ensemble forecasts probabilities in complex terrain from low-resolution model are likely to have large systematic errors. 46 Ref: Leung and Qian, 2003, J. Hydrometeorology
Statistical downscaling as alternative to provide high-resolution information Reforecast-based calibration technique based on low-resolution global model. On the left are old forecasts similar to today’s ensemble- mean forecast. For feeding ensemble streamflow model, form an ensemble from the accompanying analyzed weather on the right-hand side. 47 Ref: Hamill and Whitaker, MWR, Nov 2006
Summertime convectionin US Great Plains. • Week-long simulation of WRF model over US using 4-km grid spacing, explicit convection. • Forecast and observed Hovmollers shows eastward propagating streaks of precipitation. This eastward propagation is not forecast correctly in models with convective parameterizations (not shown; see Davis et al. 2003) • Statistical downscaling won’t help much in a situation where the forecast model can’t correctly propagate the feature of interest. • For this mode of convection, there appears to be little substitute for a high-resolution, explicitly resolved ensemble. 48 Ref: Trier et al., JAS, Oct 2006. See also Davis et al., MWR, 2003.
Resolution / ensemble size Again, why less members with more resolution may be better: With some phenomena like supercells, they simply won’t exist in lower-resolution models. 49 c/o NCEP/SPC Spring Experiment (Weiss, Kain, et al., 2007)
21-member,multi-model, multi-parameterization, perturbed initial condition ensemble forecast system. Here, example of joint probability of high CAPE,high wind shear for severe-storms forecasting. …though probabilities may be able to be estimated from large-scale conditions from coarser-resolution model 50 Useful page for derived products by David Bright at www.spc.noaa.gov/exper/sref/