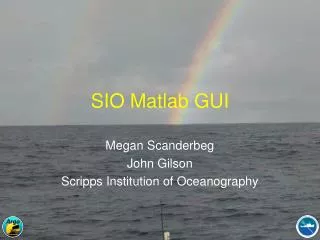
SIO Matlab GUI
SIO Matlab GUI. Megan Scanderbeg John Gilson Scripps Institution of Oceanography. Why use the SIO Matlab GUI?. GUI program that: Prepares floats for OW calibration Helps evaluate OW correction Writes the D mode files Used in coordination with other agreed upon dmode procedures:

SIO Matlab GUI
E N D
Presentation Transcript
SIO Matlab GUI Megan Scanderbeg John Gilson Scripps Institution of Oceanography
Why use the SIO Matlab GUI? • GUI program that: • Prepares floats for OW calibration • Helps evaluate OW correction • Writes the D mode files • Used in coordination with other agreed upon dmode procedures: • Thermal mass correction • First use of SIO GUI program • OW calibration • Second use of SIO GUI program • Can be used on Unix machines or PCs
First use of SIO GUI • Opens all recent/ new profiles since last dmode instance (saves profiles with data state = c & data mode = r) • Can visually inspect all profiles before OW • Can change qc flags as needed because of inversions, bad data that missed real time checks, etc. • Can look at trajectory plotted over ocean bathymetry • Four main display panels: • T or S vs. depth for single profile and one previous • T or S vs. depth for all recent/ new profiles • Location plot of all recent/new profiles • T vs. S for all recent/new profiles of that float
Can quickly check profile param_qc flags, lat/lon location and time • Check for inversions • Compare with nearby Argo or historical data (Argo data from own mirror, historical data from WOD01) • Easily change T/S flags for 1 or many points • Look at background bathymetry or salt bathymetry
Inversion Check: Red: max allowable salinity; Black: salinity; Green: temp gradient; Light Blue: podens unstable; Dark Blue: density unstable
Second use of SIO GUI • Same code as first use of SIO GUI, with following differences: • Opens all profiles for the float and saves them with data state = c & data mode = d • includes OW correction and raw data in nearby comparison windows • Allows subjective, visual check with nearby Argo • Sorts data in a variety of ways to help evaluate possible drifting • Includes an Action Panel which allows operator to modify OW correction or raw data and errors • Allows for easy acception or rejection of OW fit and saves data with comments written into scientific comment fields
Allows simple, quick rejecting or accepting of OW and saves files with correction comments Action Panel
Action Panel continued • Can adjust OW fit or raw data through simple arithmetic • Easy to adjust errors • Easy to change single point values
Summary & Conclusions • SIO Matlab GUI is a tool to prepare floats for OW calibration and to evaluate the OW fit to decide if a float is drifting • Easy to change qc flags in preparation for OW calibration • Easy to subjectively compare OW fit to nearby Argo and historical data • Easy to modify fit or adjust error size • Easy to reject or accept OW and write files with appropriate comments and data states