Robust Design
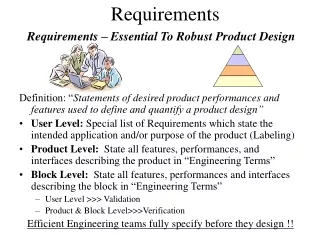
Robust Design. ME 470 Systems Design Fall 2011. What are the benefits of increasing the quality of a product?. Customers will pay for increased quality!. Customers will be loyal for increased quality!.

Robust Design
E N D
Presentation Transcript
Robust Design ME 470 Systems Design Fall 2011
What are the benefits of increasing the quality of a product? Customers will pay for increased quality! Customers will be loyal for increased quality!
In 1980s, Ford discovered that the warranty claims on US built products were far greater than Japanese built product. All products met the design specifications. There was less variation in the Japanese products
There are measurable results from less variation. • Better performance • Lower costs due to less scrap, less rework and less inventory! • Lower warranty costs
Taguichideveloped a loss function to describe the effects of variation. Target Target Loss Traditional Approach Taguichi Definition
LSL Nom USL Low Variation;Minimum Cost Cost LSL USL Nom High Variation;High Cost Cost Why We Need toReduce Variation
LSL Nom USL Off target; minimum variability Cost LSL Nom USL Cost Why We Need to Shift Means Off target; barely acceptable variability
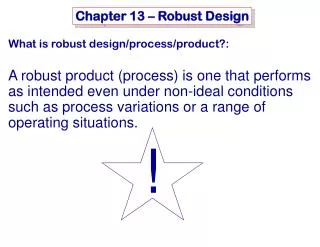
Definition of Robust Design Robustness is defined as a condition in which the product or process will be minimally affected by sources of variation. A product can be robust: Against variation in raw materials Against variation in manufacturing conditions Against variation in manufacturing personnel Against variation in the end use environment ` Against variation in end-users Against wear-out or deterioration
If your predicted design capability looks like this, you do not have a functional performance need to apply Robust Parameter Design methods. Cost, however, may still be an issue if the input (materials or process) requirements are tight!
If your predicted capability looks like this, you have a need to both reduce the variation and shift the mean of this characteristic - a prime candidate for the application of Robust Parameter Design methods.
Noise Factors are variables or parameters that affect system performance and are difficult and or expensive to control. • Examples includeclimate, part tolerances,corrosion, or wear over the life of a component.
Noise factors can be classified in many ways – customer noise, manufacturing noise, and life cycle noise can be useful classifications. • Customer usage noise • Maintenance practice • Geographic, climactic, cultural, and other issues • Duty cycle • Manufacturing noise • Processes • Equipment • Materials and part tolerances • Aging or life cycle noise • Component wear • Corrosion or chemical degradation • Calibration drift
Operating Temperature Pressure Variation Fluid Viscosity Operator Variation
There are several countermeasures for dealing with noise. • Ignore them! • Will probably cause problems later on • Turn a Noise factor into a Control factor • Maintain constant temperature in the plant • Restrict operating temperature range with addition of cooling system • ISSUE : Almost always adds cost & complexity! • Compensate for effects through feedback • Adds design or process complexity • Discover and exploit opportunities to shift sensitivity • Interactions • Nonlinear relationships
The Parameter Diagram X1 X2 . . . Xn Control Factors Outputs Y1 Y2 . . . Yn System Inputs Noise Factors The Parameter Diagram is another way to describe an Engineering System. Z1 Z2 . . . Zn
USL LSL =f( ) X1 X2 Xn Y =f( ) Y X1 X2 Xn The traditional approach to variation reduction is to reduce variation in X’s What are the advantages and disadvantages of this approach?
Robust Design identifies factors that cause variation in Y. • Variation in Y can be described using the mathematical model: where Xn are Control Factors Zn are Noise Factors
A factor that has little or no effect on either the mean or the variance can be termed an Economic Factor Economic factors should be set at a level at which costs are minimized, reliability is improved, or logistics are improved Main Effects Plot A Factors That Have No Effects
Another Source of Variance Effects: Nonlinearities High sensitivityregion Expected Distribution of Y Low sensitivityregion Factor A has an effect on both mean and variance Two Possible Control Conditions of A
Mean Shift Variance Shift A + A + A - A - Noise Noise Mean and Variance Shift A + Non-linearity A - Noise Summary of Variance Effects
Step 1 Reduce the variability by exploiting the active control*noise factor interactions and using a variance adjustment factor Step 2 Shift the mean to the target using a mean adjustment factor Factorial and RSM experimental designs are used to identify the relationships required to perform these activities Variance Shift Mean Shift A + B + A - Noise B - Noise Robust Design Approach, 2 Steps
Design Resolution • Full factorial vs. fractional factorial • In our DOE Frisbee thrower experiment, we used a full factorial. This can become costly as the number of variables or levels increases. • As a result, statisticians use fractional factorials. As you might suspect, you do not get as much information from a fractional factorial. • For the screening run in lab last week, we started with a half-fractional factorial. (Say that fast 5 times!)
Fractional Factorials A Fractional Factorial Design is a factorial design in which all possible treatment combinations of the factors are NOT run. The runs are just a FRACTION of the full factorial matrix. The resulting design matrix will not be able to estimate some of the effects, often the interaction effects. Minitab and your statistics textbook will tell you the form necessary for fractional factorials.
-1, +1, +1 +1, +1, +1 -1, +1, -1 +1, +1, -1 -1, -1, +1 +1, -1, +1 -1, -1, -1 +1, -1, -1
Design Resolution • Resolution V (Best) • Main effects are confounded with 4-way interactions • 2-way interactions are confounded with 3-way interactions • Resolution IV • Main effects are confounded with 3-way interactions • 2-way interactions are confounded with other 2-way interactions • Resolution III (many Taguchi arrays) • Main effects are confounded with 2-way interactions • 2-way interactions may be confounded with other 2-ways
Minitab Explanation for Screening Run in Lab Factors: 4 Base Design: 4, 8 Resolution: IV Runs: 16 Replicates: 2 Fraction: 1/2 Blocks: 1 Center pts (total): 0 Design Generators: D = ABC Alias Structure I + ABCD A + BCD B + ACD C + ABD D + ABC AB + CD AC + BD AD + BC A = Ball Type B = Rubber Bands C = Angle D = Cup Position Means main effects can not be distinguished from 3-ways. Means certain 2-way interactions can not be distinguished.
Hubcap Example of Propagation of Errors The example is taken from a paper presented at the Conference on Uncertainty in Engineering Design held in Gaithersburg, Maryland May10-11, 1988.