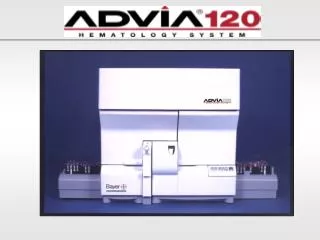
ADVIA 120 TECHNOLOGY
ADVIA 120 TECHNOLOGY. ADVIA 120. Hematology Analyzer Complete Blood Count (CBC) White Blood Cell Differential (Diff) Reticulocyte Analysis (Retic) Analysis on one aspiration of whole blood 120 CBC/Diff samples per hour Random Access Test Selectivity. Sample Handling. Auto. Open.


ADVIA 120 TECHNOLOGY
E N D
Presentation Transcript
ADVIA 120 • Hematology Analyzer • Complete Blood Count (CBC) • White Blood Cell Differential (Diff) • Reticulocyte Analysis (Retic) • Analysis on one aspiration of whole blood • 120 CBC/Diff samples per hour • Random Access Test Selectivity
Sample Handling Auto Open Closed 3 Modes of Aspiration • Multiple tube size • Multiple tube types • Small sample volume (157uL)
Unified Fluids Circuit (UFC) The UFC assembly uses Unifluidics technology. The UFC block is made up of eight acrylic plates. Machined within these plates are the pathways for the fluids and air flow, valves, and four reaction chambers. An additional chamber is mounted on the outside surface of the UFC block. The reagent pump assembly, mounted to the bottom of the UFC block, is also acrylic.
Dividing the Sample The Sample Shear Valve divides the sample into 5 aliquots for the different types of tests. The reagents and sample segments are delivered to their respective reaction chambers for mixing and aspiration. Side View of UFC
The HGB Method ADVIA 120 HGB contains: - Potassium cyanide, 20 mmol/L - Dimethyllaurylamine oxide, 2.0% Reaction: - Red blood cells are lysed to release hemoglobin. - The heme iron in the hemoglobin is oxidized from the ferrous to the ferric state, and then it is combined with cyanide in the ADVIA 120 HGB reagent to form the reaction product. CYANISATION HEMOGLOBIN + HGB reagent METHEMOGLOBIN CYANIDE HGB Fe++ Fe+++ Fe+++.CN
HGB reaction chamber Lamp assembly UFC Filter + Photodiode The HGB Method Optical readings are obtained colorimetrically at 546 nm.
The HGB Method 1. ADVIA 120 Sheath/Rinse reading from previous cycle 2. Draining and refilling with the reaction solution 3. Reaction solution readings (Sample Mean) 4. Draining and refilling with the ADVIA 120 Sheath/Rinse 5. ADVIA 120 Sheath/Rinse readings (Baseline Mean) seconds
Calculating reported parameters The HGB Method • HGB Hemoglobin (directly measured) • MCH (HGB ÷ RBC) x 10 (Mean Corpuscular Hemoglobin) • MCHC(HGB ÷ [RBC x MCV]) x 1000 (MeanCorpuscular Hemoglobin Concentration)
Shuttle chamber Sheath stream Sample stream FLOWCELL TECHNOLOGY ADVIA 120 SHEATH encases the sample stream as the two fluids pass through the flowcell. Light detects the cells as they pass through the light path.
The RBC Method ADVIA 120 RBC/PLT contains: - Sodium dodecyl sulfate, 0.035 mmol/L - Disodium EDTA dihydrate, 4.03 mmol/L - Tetrasodium EDTA dihydrate, 3.36 mmol/L - Sodium chloride, 109.3 mmol/L - Glutaraldehyde, 0.11% - Buffer Reaction: - ADVIA 120 RBC/PLT reagent contains sodium dodecyl sulfate (SDS) and glutaraldehyde that causes sphering of the red blood cells and platelets. When red cells and platelets are isovolumetrically sphered, shape is eliminated as a variability factor. - RBCs and platelets are fixed
No matter what your shape or size .... We can make you a SPHERE The RBC Method
Low angle scatter 2o - 3o (Volume) High angle scatter 5o - 15o (HGB concentration) The RBC Method
Laserdiode Sample stream Beamsplitter Dark stop Mirror Referentie signaal Absorption Low-angle High-angle detector scatter scatter detector detector Front view of the dark stop The RBC Method
The RBC Method The RBC Scatter cytogram is the graphical representation of two light-scatter measurements: the high-angle light scatter (5° to 15°) is plotted along the x axis, and the low-angle light scatter (2° to 3°) is plotted along the y axis. 1. Low-angle light scatter (2° to 3°) 2. High-angle light scatter (5° to 15°) 3. Mie map containing RBCs 4. Platelets detected in RBC method
The RBC Method The Volume/Hemoglobin Concentration (V/HC) cytogram is a linear version of the RBC map that appears on the RBC cytogram. On the V/HC cytogram, hemoglobin concentration is plotted along the x axis and cell volume is plotted along the y axis. Only red blood cells appear on this cytogram. 1. 60 fL volume marker 2. 120 fL volume marker 3. 28 g/dL HC marker 4. 41 g/dL HC marker
120 60 28 41 The RBC Method Macrocytic Normocytic Normochromic Hyperchromic Hypochrmic Volume - MCV Microcytic HGB Concentration - CHCM
The RBC Method Volume - MCV HGB Concentration - CHCM
120 60 28 41 The RBC Method
The RBC Method • The RBC Volume histogram represents the • distribution of red blood cells by cell volume. • The histogram has a range from 0 fL to 200 fL. • Normal samples have a bell-curve shaped • distribution with a mode channel between • 60 fL and 120 fL. • The mean corpuscular volume (MCV) and • the red cell distribution width (RDW) are • determined from this histogram. • MCV is the mean of the of RBC Volume • histogram. • RDW is the coefficient of variation of the • population.
The RBC Method • The RBC hemoglobin concentration (RBC HC) • histogram represents the distribution of red blood • cells by cellular hemoglobin concentration. • The histogram has a range from 0 g/dL to 50 g/dL. • Normal samples have a bell-curve shaped • Hgb concentration distribution with a mean • channel between 28 g/dL and 41 g/dL. • The cell hemoglobin concentration mean (CHCM) • and the hemoglobin distribution width (HDW) are • obtained from this histogram. • CHCM is the mean of the RBC HC histogram. • HDW is the standard deviation of the RBC HC • histogram.
The RBC Method • The RBC CH (cellular hemoglobin) histogram • represents the distribution of red blood cells by • the amount of hemoglobin present in each cell • independent of cell volume. • The histogram has a range from 0 picograms to • 100 picograms. • Cellular Hemoglobin Content (CH) is the mean of • the RBC CH histogram. • Cell hemoglobin distribution width (CHDW) • is the standard deviation of the RBC CH histogram.
Calculating reported parameters The RBC Method • RBCNumber of Red Cells (directly measured) (Red Blood cel Count) • MCV Mean of RBC Volume histogram (Mean Corpuscular Volume) • HCT(RBC x MCV) ÷ 10 (Hematocrit) • MCH (HGB ÷ RBC) x 10 (Mean Corpuscular Hemoglobin) • MCHC(HGB ÷ [RBC x MCV]) x 1000 (MeanCorpuscular Hemoglobin Concentration)
Calculating reported parameters The RBC Method • CHCM Mean of RBC HC histogram (Corpuscular Hemoglobin Concentration Mean) • CH Mean of RBC CH histogram (Corpuscular Hemoglobin content) • RDW100 x (SD of RBC Volume histogram ÷ MCV) (Red cell volume Distribution Width) • HDW SD of RBC HC histogram (Hemoglobin concentration Distribution Width)
Calculating reported parameters The RBC Method • %MICRO Percent of red blood cells smaller than 60 fL • %MACRO Percent of red blood cells larger than120 fL • %HYPO Percent of red blood cells with less than 28 g/dL HGB • %HYPER Percent of red blood cells with more than 41 g/dL HGB The three severity levels are: +, ++ or +++ and are customized by Bayer for each customer site based on the technologists severity levels on the manual differentials
The Platelet Method The 2-Dimensional platelet analysis (2D-PLT method) is based on the integrated analysis of red blood cell and platelet measurements. Area of Platelet Analysis
The Platelet Method • Using the Mie theory of light scattering for homogeneous • spheres , the low-angle and high-angle light scatter signals • for each cell are transformed into volume and refractive index values. • The PLT Scatter cytogram is the graphical representation • of two light-scatter measurements • (5° to 15°), scatter is plotted on the x axis • (2° to 3°), scatter is plotted on the y axis Volume = Size Refractive Index = Platelet Content
2 5 3 1 4 The Platelet Method PLATELET CYTOGRAM 1 Platelets 2 Large platelets 3 Red blood cells 4 RBC fragments 5 RBC ghosts
The Platelet Method The 2D-PLT VOL histogram shows the distribution of cells by volume. Volume data are obtained from the integrated analysis. The histogram has a range from 0 fL to 60 fL.
Calculating reported parameters The Platelet Method • PLTPLT Count x RBC Cal Factor x PLT Cal Factor (Platelet count) • MPV Mean of 2D-PLT Vol histogram (Mean Platelet Volume) • Large LPLT Platelets with volumes greater than 20 fL (LargePlatelets)
Morphology Flags The Platelet Method • LPLT The percentage of large platelets (%LPLT) is greater than (Large Platelets) 10% of the platelet count • RBCF The presence of RBC fragments is suspected. This flag is (RBCFragments) triggered if the number of events in the RBC Fragment area of the PLT Scatter cytogram is greater than 100,000 cells/ul • RBCG The presence of RBC ghosts is suspected. This flag occurs if (RBCGhosts) the number of events in the RBC Ghost area of the PLT Scatter cytogram is greater than 100,000 cells/ul The three severity levels are: +, ++ or +++
The Retic Method ADVIA 120 autoRETIC contains: - Oxazine 750, 11.4 mg/L - Buffer - N-Tetradecyl-N,N-dimethyl-3-ammonio-1-propane sulfonate, 0.023 mmol/L Reaction: The ADVIA 120 autoRETIC reagent contains a zwitterionic detergent (surfactant) that isovolumetrically spheres the red cells. It also contains a cationic dye, Oxazine 750, that stains cells according to their RNA content.
The Retic Method Laserdiode Sample stream Beamsplitter Dark stop Mirror Referentie signaal Absorption Low-angle High-angle detector scatter scatter detector detector Front view of the dark stop
The Retic Method • The RETIC Scatter ABS cytogram is the graphical representation of the absorption and light-scatter measurements: • absorption (cell maturation) is plotted along the x axis • light scatter (cell size) is plotted along the y axis. • 1 RTC Platelet threshold • 2 RTC Coincidence threshold • 3 RTC threshold • 4 Low/Medium RTC threshold • 5 Medium/High RTC threshold • A Mature RBCs • B Low absorption retics • C Medium absorption retics • D High absorption retics • E Platelets • F Coincidence events
The Retic Method The RETIC Volume histogram represents the overlaid distributions of mature RBCs and reticulocytes by cell size only. The histogram has a range from 0 fL to 200 fL.. The RETIC hemoglobin concentration (RETIC HC) histogram represents the overlaid distributions of mature RBCs and reticulocytes by cellular hemoglobin concentration only. The histogram has a range from 0 g/dL to 50 g/dL. Mature RBC population (red) Reticulocyte population (blue)
The Retic Method The RETIC cellular hemoglobin (RETIC CH) histogram represents the overlaid distributions of mature RBCs and reticulocytes by the actual weight or mass of hemoglobin present in each cell. The histogram has a range from 0 pg to 100 pg. Mature RBC population (red) Reticulocyte population (blue)
Calculating reported parameters The Retic Method • %RETIC100 x (RETIC Count) x % Retic Cal Factor (%Reticulocytes) • #RETICRBC x (%Retic ÷ 100) (#Reticulocytes) • MCVrMean of the RETIC Volume histogram for the reticulocyte (Mean Cell Volume populationreticulocytes) • CHrMean of the RETIC CH histogram for the reticulocyte (Cellular Hemoglobin population content reticulocytes) • CHCMrMean of the Retic HC histogram for the reticulocyte population (Cell Hemoglobin Concentration Mean reticulocytes)
Calculating reported parameters The Retic Method • IRF-H100 x (#HRetic ÷ RETIC Count) (Immature Reticulocytes Fraction High) • IRF-M+H100 x ([#HRetic + #MRetic] ÷ RETIC Count)(Immature Reticulocytes Fraction Medium + High) These Parameters Not FDA Cleared For Reporting - Investigational Use Only
Beginning After 4 days After 2 weeks After 1 month The Retic Method Erythropoietin Treatment
The Perox Method ADVIA 120 PEROX 1 contains: - Sodium dodecyl sulfate, 0.36 mmol/L - Sorbitol, 620 mmol/L - Sodium chloride, 8.35 mmol/L - Formaldehyde, 5.5% - BRIJ-35, 0.100 mmol/L - Buffer Reaction: - Surfactants (sodium dodecyl sulfate and Brij-35) in combination with thermal stress lyse the red blood cells. - Formaldehyde fixes the white blood cells.
The Perox Method ADVIA 120 PEROX 2 contains: - 4-Chloro-1-naphthol, 44.8 mmol/L - Diethylene glycol, 99.2% ADVIA 120 PEROX 3 contains: - Stabilizer - Hydrogen peroxide, 0.3% Reaction: - The 4-Chloro-1-naphthol in ADVIA 120 PEROX 2 serves as a substrate that enables the hydrogen peroxide in ADVIA 120 PEROX 3 to form a dark precipitate at sites of peroxidase activity in the granules of white blood cells as described by the following equation: cellular peroxidase H2O2 + 4-chloro-1-naphthol dark precipitate within the cells
If you have the granules - we have the stain I’m melting PEROX STAIN But you still look pale Boy, your granules look great ! The Perox Method
The Perox Method Number of neutrophil granules Bone marrow Blood Promyelocytes Myelocytes Metamyelocytes # granules Band cells Mature PMN Blasts Cell maturation
The Perox Method Cytochemical classification according to peroxidase activity Cel type Peroxidase Myeloblasts -, sometimes ½+ (especially micromyeloblasts) Promyelocytes 3+ Myelocytes 3+ Metamyelocytes 3+ Band cells 2-3+ Neutrophils 2+ Eosinophils 4+ Basophils ½-1+ (stay unstained in the ADVIA 120) Lymphoblasts - Prolymphocytes - Lymphocytes - Atypical lymphocytes - Monoblasts - Promonocytes ½-1+ Monocytes 1+ Plasma cells - Nucleated red blood cells -
The Perox Method Absorption detector Filter Scatter detector Sample stream Tungsten lamp Dark stop Beam splitter