Too many people?
Too many people?. Year 8 Humanities Homework booklet. Key Terms. Before you can study population geography you need to know the meaning of some important words. Task: Link each key term in the table below with a line to its definition (or meaning). Extension Activity:

Too many people?
E N D
Presentation Transcript
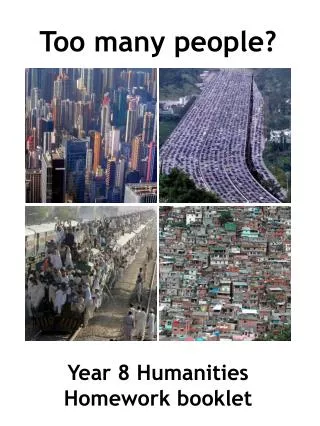
Too many people? Year 8 Humanities Homework booklet
Key Terms Before you can study population geography you need to know the meaning of some important words. Task: Link each key term in the table below with a line to its definition (or meaning). Extension Activity: Research the following key terms and write a definition in the space provided:
How is the world’s population changing? millions 7000 6000 5000 4000 3000 2000 First farms appear 1000 1 AD 1000 2000 10000 BC 5000 BC • The world’s population has grown steadily since 10,000 BC. • The world’s population grew slowly until 1000, accelerating after 1800. • The world’s population grew slowly until 1000, accelerated after 1800, then started to slow down.
How is the world’s population changing? The 31st October 2011 was an important date. The world’s population passed 7 billion. That’s 7,000,000,000 people! How did it get there? Tasks: 1. A graph is a great way to show how something is changing. Draw a linegraph to show the change in the world’s population. (It’s started for you on the opposite page.) Use the figures in Table 1. 2. Adding the labels in Table 2 to your graph will bring it alive. Link each label to the appropriate place on the graph line you have drawn. An example has been done for you. 3. Remember, the steeper the graph line, the quicker the population is changing. Circle the sentence below the graph which best describes how the world’s population has grown. Extension activity: What do you think will have happened to the world’s population by 2500? Give a reason for your answer. …………………………………………………………………………………………………………………………………………………………………………………………………………………………………………………………
Why do populations change? • The world’s population is growing rapidly, but it is not rising at the same rate in all parts of the world. In some countries it is rising fast. In other countries the population is rising slowly, or even falling. To understand why populations change you need to understand the relationship between the birth rate and the death rate. • Task: • 1. Remind yourself, what do these terms mean? • Birth rate …………………………………………………………………………………………………… • Death rate …………………………………………………………………………………………………. • 2. Table 3 shows 10 things that could happen in a country. Next to each write the effect it would have on the birth rate or the death rate. Select from: • Death rate rises, Death rate falls, Birth rate rises, Birth rate falls
Why do populations change? The study of population is called demography. People who study population change say that most countries’ populations pass through 4 stages as their population grows. This is called the population cycle and is shown below: • Task: • 1. What would happen to the total population of a country if: • Death rate is higher than birth rate – population rises/falls/stays the same • Birth rate is higher than death rate – population rises/falls/stays the same • Death rate and birth rate are equal – population rises/falls/stays the same • 2. You can see that the population cycle has 4 stages. What happens to the total population (the red line) at each stage: • Stage 1: Birth rate and death rate are both high. The population ………………. • Stage 2: Birth rate stays high, death rate starts to fall. The population ………………. • Stage 3: Birth rate and death rate are both falling. The population ………………. • Stage 4: Birth rate and death rate are both low. The population ………………. Extension activity: At which stage do you think the following countries would be? Label them on the graph. The United Kingdom, China, Burkina Faso (West Africa), Germany
Where is everyone? Greenland Mexico City London Australian Outback People are spread very unevenly around the world. How people are spread out is called the population distribution. Some places in the world are empty, they are sparsely populated. Other places are very crowded. They are densely populated. How many people live per square kilometre is called population density. • Task: • 1. Look at the photos above. Decide if they are sparsely or densely populated: • Greenland: ……………………………. • Mexico City: ……………………………. • London: ……………………………. • The Australian Outback: ……………………………. • 2. Label these 4 places on the map opposite.
Where is everyone? The map below shows the distribution of the world’s population. Task: 3. What colour is used to show areas where : the population is very dense ……………………….. hardly anyone lives ………………………. • 4. Circle those statements below that accurately describe the overall distribution of the world’s population: • Most people live on or near the coasts • Most people live in the middle of the world’s continents • Few people live in the middle of the world’s continents • Europe is very densely populated • It is densely populated in the north around the Arctic Circle • Extension activity: Name 2 other regions of the world that are: • very densely populated ……………………………… ……………………………… • sparsely populated ……………………………… ………………………………
Where is everyone? The distribution of the world’s population has not happened by chance. There are reasons to explain why some places attract people to live while other places are avoided by people. Task: 5. Look at the characteristics of places in Table 4 below. Next to each, write whether the characteristic is likely to: encourage people to live there discourage people to live there • 6. Go back and look at the 4 pictures of different places. For each, give one reason why they are either densely populated or sparsely populated: • Greenland: …………………………………. • Mexico City: …………………………………. • London: …………………………………. • The Australian Outback: …………………………………. Extension activity: Name an example of a place (e.g. a region, country, city) with the characteristics in Table 4.
What are population pyramids and what problems can they identify? A population pyramid is a bar chart that shows the population of a country divided-up into different age groups. By looking at it we can see how many people there are in each age group and how many of them are males and how many are females. A population pyramid for the UK A population pyramid for India Population (millions) Population (millions) Age group Age group Task: Look at the population pyramids for India and the UK to help you answer these questions: 1. Roughly how many people are below the age of 19 in India? _________million 2. Is this higher or lower than in the UK?_________________ 3. Can you think of 3 problems that this may cause for the government of India? _____________________________________________________________________ _____________________________________________________________________ 4. Roughly how many people are over the age of 65 in the UK? _________million 5. Is it higher or lower than in India?________________ 6. Can you think of 3 problems that this may cause for the government of the UK? _____________________________________________________________________ _____________________________________________________________________
What have been the impacts of population growth in the cities of Brazil? This is a ‘favela’ (a shanty town or slum) in Sao Paulo Sao Paulo Rio de Janiero Read the following passage: Brazil is a country that has a high birth rate but also quite a high death rate. Most of people live in large cities in Brazil like Sao Paolo and Rio de Janiero. In these two cities 1 in 5 people live in shanty towns known as favelas. A favela is a collection of shacks built on waste ground, without permission from the authorities or landowners. Luiz arrived in the Morumbi favela in Sao Paolo where he met his cousin Felipe. He looked around and then followed Felipe. They hurried along narrow alleys that twisted and turned. It was getting dark. There was music everywhere, and talking, and laughter. Dogs barked, babies cried, TV’s blared. Bare-foot children played on the street. Women sat on doorsteps, cooking on charcoal stoves. ‘Be careful’, said Felipe, as they crossed a gutter filled with sewage. And then they were home. A shack of brick and corrugated iron, wood and plastic. They went in the big open door. Luiz had a meal of his favourite stew that night. Luiz did not sleep much. The floor was hard, and he was too excited about living in the city. The favela was very overcrowded, there were shacks everywhere and built from anything people could find. There was no running water or legal electricity. Some families had illegally put a line into a mains electricity pylon to get power. There was no sewage system so people often used the open drains as toilets. No one collects the rubbish so it sits in the streets where it rots and attracts rats. The children who live in the favela go to school when they are younger but not many finish their schooling. Instead they beg on the streets and many of the girls end up getting pregnant at an early age. This is what leads to the high birth rate. Life in the favela’s is often unsafe. The crime rate is high and drugs, violence and murders are common. Many people die at a young age in the favelas because of the awful conditions and poor quality of life they have. Your tasks are on the next page
What have been the impacts of population growth in the cities of Brazil? • Task: • Imagine you are work for an organisation offering aid (help) to the favelas of Sao Paulo. Write a postcard to a friend or family member in England telling them what your day is like in the favela. • Find a picture that would be suitable for the front of the postcard and glue it in. (If you can’t find a picture, draw one. Use colour.)
China – what has it done to try and control the largest population in the world? As recently as 1950, China's population was only 563 million. The population grew dramatically through the following decades to one billion in the early 1980s. Today, with just over 1.3 billion people, China is the world's most populated country. As the world's population recently passed 7 billion, China represents 20% of the world's population, so one in every five people on the planet lives in China. China's population growth has been slowed by the one child policy, introduced in 1979. The policy limits couples to one child. If a woman got pregnant for a second time they were fined, made to have an abortion, and even forced to be sterilised (this makes them infertile and means they cannot have another child). However, this policy was not enforced in all of China, it was mainly in the big cities. People living in rural areas did not have to follow this law. Nevertheless, it is estimated that the policy has reduced population growth in China by as many as 300 million people over its first twenty years. In Chinese culture it is very important to have a son. This is because a son will carry on the family name. Also, when a couple get married the woman always goes to live with her new husband’s family. If you have a son it means there will be someone to look after you when you get old. The one child policy meant that many families were not happy when they knew they were expecting a baby girl or when a girl was born. There was an increase in abortions and many new born baby girls were abandoned. It is thought that some parents even practised infanticideand murdered their baby girl. As a result of this very strict rule there is a ratio of 114 males for every 100 females among babies. (Normally, 105 males are naturally born for every 100 females.) and men in their 20s and 30s cannot find wives. Despite the one child policy, China's population is expected to continue to grow over the next few decades. This is mainly due to a decrease in infant mortality and a decrease in death rate as diet, living conditions and healthcare improves. By 2020, China's population is expected to pass 1.4 billion. However, around 2030, China's population is predicted to reach its peak and then slowly start dropping. Your tasks are on the next page
China – what has it done to try and control the largest population in the world? • Tasks: • 1. Imagine you lived in China. Give 2 positive points (good things) about the ‘one child policy’ and 2 negative points (bad things). • One positive point (good thing) about the one child policy is… • __________________________________________________________________ • __________________________________________________________________ • Another positive point (good thing) about the one child policy is… • __________________________________________________________________ • __________________________________________________________________ • One negative point (bad thing) about the one child policy is… • __________________________________________________________________ • __________________________________________________________________ • Another negative point (bad thing) about the one child policy is… • __________________________________________________________________ • __________________________________________________________________ • 2. What are your views about the one child policy? Why? • __________________________________________________________________ • __________________________________________________________________ • __________________________________________________________________ • 3. If you were asked to help a country by offering your ideas about how to reduce its population size, what would be your best idea and why? • __________________________________________________________________ • __________________________________________________________________ • __________________________________________________________________ • __________________________________________________________________