Download
1 / 1
10 likes | 157 Vues
1,2 M Fowell, 1 N.A Chappell, 2 A.R MacKenzie 1 Hydrology & Fluid Dynamics Group, 2 Atmosphere Biosphere interactions Groups, Environmental Science Department, Lancaster Environment Centre, Lancaster University, Lancaster. LA1 4YQ Email: m.fowell@lancs.ac.uk.

E N D
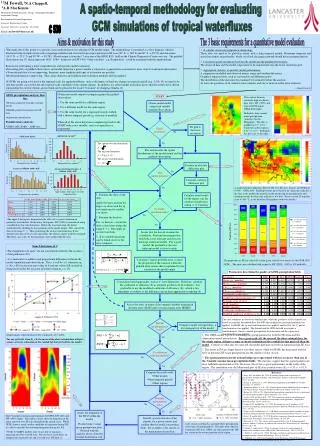
1,2M Fowell,1N.A Chappell, 2A.R MacKenzie 1Hydrology & Fluid Dynamics Group, 2Atmosphere Biosphere interactions Groups, Environmental Science Department, Lancaster Environment Centre, Lancaster University, Lancaster. LA1 4YQ Email: m.fowell@lancs.ac.uk A spatio-temporal methodology for evaluating GCM simulations of tropical waterfluxes C 530 Aims & motivation for this study The 3 basic requirements for a quantitative model evaluation • The main aim of this poster is to present a new methodology for evaluating GCM model output. The methodology is presented as a flow diagram, which is illustrated with examples from work comparing modelled and observed tropical precipitation in SE Asia (90 E 160 E and 20 S 30 N)and Amazonia (14.5 N 25.5 S and 90 W 30 W). Model output is from the 17-year run of the GFDL R30, held on the Climate Diagnostics Centre web site. The gridded observations are (7) which represent 1920 - 1980 - from now on LW 1990. Other variables - e.g. Evaporation - could be examined with this methodology. • Reasons for performing a more comprehensive and rigorous model evaluation: • Presenting plots of gridded observations and model output for a given variable is subjective; a quantitative assessment is more objective and more informative. • Observational data sets are improving, therefore, more sophisticated types of evaluation are possible • Model performance is improving. Thus, more objective and sophisticated evaluation methods will be required. • If GCMs are going to be used at the regional scale, for applied problems, such as the impact of land-use change on tropical rainfall (e.g. 3; 10; 11) we need to be sure that models can resolve the sub-regional scale variability of the current climate. In addition, if a robust model evaluation shows that the models have skill in representing the current climate, greater faith can be placed in the model “forecasts” of changing climates (1). • . A suitable observed precipitation climatology. • These data sets need to be global in extent with a long temporal period. Maximum temporal and spatial resolution are preferable, whilst over land, the gauge network should have maximum density. • .Consistent spatial resolutions between the model and the gridded observations. • The observed data and the model output need to be transformed onto the lower resolution grid. • .Appropriate statistics to quantify model performance. • A comparison modelled and observed means, range and standard deviations • Graphical representation, such as scatter plots and difference plots • The distribution of the data must be examined for normality before the analysis. • At least one goodness-of-fit (relative error estimate) and one or more absolute error estimates. • (Adapted from 4) • Obtain new model output to compare against the gridded observations. • . Use the same model for a different region. • . Use a different model for the same region. • . Use the same model, for a region previously studied, with a shorter temporal period e.g. seasonal or monthly. • When all of the above have been completed go back to the START with a new variable, such as evaporation or temperature • GFDL precipitation analysis, thus far: • SE Asian annual & 3-month seasonal means. • Monthly partial zonal means for SE Asia. • Amazonian annual mean. • Possible future analysis: • UKMO, MPI, BMRC - AMIP runs. START The contrast between relatively high resolution data (left), LW (1990), and typical GCM output, GFDL R30 (right). Both plots show annual mean precipitation (mm/day) for the Philippines. The data is gridded to 0.5 x 0.5 , while the model output is 2.25 x 3.75 . Both plots use the scale on the right. Obtain annual model output and suitable gridded observations Equal resolution? Re grid to the lower resolution No Yes Plot and describe the spatial distributions of the model output and the gridded observations Produce an absolute difference plot Very similar patterns? No Consider a relative difference plot Yes A shaded absolute difference plot for JJA over SE Asia: Legates and Willmott (1990) – GFDL R30. Shading towards the red end of the spectrum, indicates a dry bias in the model (the model in under-predicting the precipitation) and shading towards the blue end, indicates a wet bias. Biases exceed 20 mm/day, close to 100 E, in the Northern Hemisphere (both wet and dry) 1. Examine the skew of the data. Apply the log transform for large +ve skews and the sq root transform for smaller +ve skews. 2. Examine the kurtosis. For -ve kurtosis, convert the data so that it lies within the range 0 1, then apply an arcsine transform. 3. If no suitable transform can be found, move to the error estimates. Calculate error bounds for the region, e.g. the number of grid boxes within +/- 0.5 mm/day Normally distributed data? No • The upper 2 histograms demonstrate the effect of a sq root transform on positively skewed data. On the lower histograms, LW (1990) is normalised using a modified arcsine transformation. Before the transformation, the data is standardised by dividing by the maximum of the model output. This convert the data to the range 0 - 1. Thus, permitting the arcsine transformation. If one divided each data set by its own maximum, the relative ranges would be changed. Therefore, one scales by the maximum value within both data sets. Yes Scatter plot the data & examine the correlation. Perform linear regression with both a zero intercept and non-zero intercept statistical models. For a good model, the gradient for the zero intercept model is close to unity. • Some Limitations of r2 • The magnitudes of r and r2 are not consistently related to the accuracy of the prediction (12). • r2 is insensitive to additive and proportional differences between the model simulation and observations. Thus, r2 will be 1.0, whenever mi = (Aoi + B) for any non-zero value of A and any value of B, instead of being reserved for the occasion of interest when mi = oi (5). Calculate r2 and its probable error, to show the proportion of the variance within the gridded observations that is explained by the variation in the model output. The proportion of SE Asia that falls within given rainfall error bands, for the GFDL R30 GCM, . The errors are calculated with respect to LW (1990). 100% is 418 grid cells. Parameters describing the quality of GFDL precipitation fields. Correlation based approaches, such as r2, have limitations. Therefore, calculate the coefficient of efficiency (8) as alternate goodness-of-fit estimates. It is preferable to use the modified coefficient of efficiency (E1), which is less dependent on outliers as the differences given their appropriate weighting (6). Assess the error in terms of the original variables using mean absolute error (MAE) and root mean square error (RMSE). The error estimates are based on standard data, while the goodness-of-fit estimates are based on normally distributed data For DJF, the modified arcsine transformation was applied; for MAM, the sq root transformation was applied; and for JJA, the 2/3 power transformation was applied. The Annual and the SON data did not require a transformation. Amaz is annual precipitation for Amazonia and the square root transformation was applied. Did the model perform “well”? Compare zonally averaged data - a less stringent test of the model. No Diagrammatic representation of the components of r2 and E1. For any grid cell, when E1 < 0, the mean of the observational data will give a more accurate estimation of the rainfall for that grid cell the the model. • . The GFDL model is poor at simulating the spatial patterns for both the SE Asian and the Amazonian annual precipitation. For a given grid cell, the mean of the observational data, for the whole region, will give a more accurate estimation of the rainfall for that grid cell than the model. Contrary to what may be expected, the model performs no better in Amazonia than SE Asia. • .The errors in JJA are larger than for any other season, while for MAM, the mean error and the error in the mean SE Asian precipitation are the smallest of any season. • . The spatial patterns for the annual budget are represented with less accuracy than any of the 3-month seasonal mean precipitation fields. The statistics suggest that the spatial patterns are most faithfully represented in JJA. However, this is due to good performance in the south of the region. The simulation over the Monsoonal part of SE Asia is much worse (E1 = -0.35; r2 = 0.15). Yes 1st evaluation with this method? Yes No • Compare the results with: • Other models • Other temporal periods • Other regions • References • .Airey, M.J. and Hulme, M., 1995. Evaluating climate model simulations of precipitation: methods, problems, and performance. Progress in Physical Geography, 19(4): 427-448. • .Gadgil, S. and Sajani, S., 1998. Monsoon precipitation in the AMIP runs. Climate Dynamics, 14: 659-689. • .Henderson-Sellers, A. et al., 1993. Tropical deforestation: Modelling local to regional scale climate change. Journal of Geophysical Research, 98(D4): 7289-7315. • .Hulme, M., 1992. A 1951-80 global land precipitation climatology for the evaluation of general-circulation models. Climate Dynamics, 7(2): 57-72. • .Legates, D.R. and Davis, R.E., 1997. The continuing search for an anthropogenic climate change signal: Limitations of correlation-based approaches. Geophysical Research Letters, 24(18): 2319-2322. • .Legates, D.R. and McCabe, G.J., 1999. Evaluating the use of "goodness-of-fit" measures in hydrologic and hydroclimatic model validation. Water Resources Research, 35(1): 233-241. • .Legates, D.R. and Willmott, C.J., 1990. Mean seasonal and spatial variability in gauge-corrected, global precipitation. International Journal of Climatology, 10(2): 111-127. • .Nash, J.E. and Sutcliffe, J.V., 1970. Riverflow forecasting through conceptual models, I, A discussion of Principles. Journal of Hydrology, 10: 282-290. • .Nieuwolt, S., 1981. The climates of Continental SE Asia. In: K. Takahashi and H. Arakawa (Editors), Climates of northern and eastern Asia. World Survey of Climatology. Elsevier, pp. 1-66. • 0.Polcher, J. and Laval, K., 1994a. A statistical study of the regional impact of deforestation on climate in the LMD GCM. Climate Dynamics, 10(4-5): 205-219. • 1.Polcher, J. and Laval, K., 1994b. The impact of African and Amazonian deforestation on tropical climate. Journal of Hydrology, 155(3-4): 389-405. • 2.Willmott, C.J., 1982. Some Comments on the Evaluation of Model Performance. Bulletin of the American Meteorological Society, 63(11): 1309-1313. Monthly precipitation data? No Yes Assess the migration of the ITCZ within the model. Produce time v zonal mean precipitation plots. Proceed with the analysis above, from the normal distribution step. • Time V partial zonal mean precipitation for GFDL R30 (left) and LW (1990) (right). These plots clearly show the migration of the major rain-belt over SE Asia throughout the annual cycle. Whilst GFDL shows a much smaller amplitude of migration during DJF, it is able to simulate the northward migration during the JJA. • Of the 30 AMIP I models, only 12 are able to simulate a migrating rain-belt over SE Asia. The rest have 2 rain-belts, an omnipresent equatorial one and a second over NH land (2). Identify specific features of the climate, for a given season, and confirm that the model can produce them. For example, a dry season, or the main monsoon rain belt. A dry season is defined as a period where precipitation is less then 50 mm/month (9). This plot shows that for Continental SE Asia, GFDL can only represent the DJF dry season in the western portion of the region.