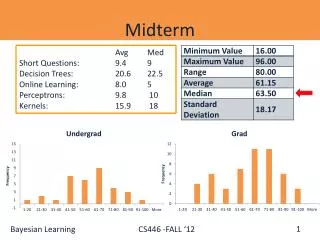
Midterm
This midterm focuses on multilevel models (MLMs) in health service performance evaluation. Students will carefully read and analyze content related to MLM variances, shrinkage, and basic computations using logit-linear models. Debriefing will include practical applications, such as profiling and ranking healthcare providers based on clinical outcomes, care quality, and costs. The assessment aims to enhance understanding of statistical challenges, incorporating patient and provider characteristics, and utilizing valid summary methods for performance measures.


Midterm
E N D
Presentation Transcript
Midterm • Open “book” and notes; closed mouth • 20-25 minutes to read carefully and answer completely • 60 minutes to think • 4 problems, with possible topics: • Some debriefing on the role of MLMs • Something on linear MLMs variances, etc. • MLMs and shrinkage • Some basic computations and interpretations of logit-linear models BIO656--Multilevel Models
PART 6 PROFILING, RANKING “League Tables” BIO656--Multilevel Models
RANKING IN THE NEWS BIO656--Multilevel Models
LETTERMAN’S TOP 10 LIST BIO656--Multilevel Models
NEW YORK’S MOST DEADLY CARDIAC SURGEONS!!!! BIO656--Multilevel Models
THE LEADING SPH IS HARVARD BIO656--Multilevel Models
HOPKINS IS THELEADING SPH!!! BIO656--Multilevel Models
PROFILING(League Tables) • The process of comparing “units” on an outcome measure with relative or normative standards • Quality of care, use of services, cost • Educational quality • Disease rates in small areas • Gene expression • Developing and implementing performance indices to compare physicians, hospitals, schools, teachers, genes, ........ BIO656--Multilevel Models
PROFILING OBJECTIVES(in health services) • Estimate and compare provider-specific performance measures: • Utilization/cost • Process measures • Clinical outcomes • Patient satisfaction/QoL • Compare using a normative (external) or a relative (internal) standard BIO656--Multilevel Models
RANKING IS EASY Just compute estimates & order them BIO656--Multilevel Models
MLE ESTIMATED SMRs BIO656--Multilevel Models
RANKING IS DIFFICULT Need to trade-off the estimates and uncertainties BIO656--Multilevel Models
MLE ESTIMATED SMRs & 95% CIs BIO656--Multilevel Models
Sampling variability &Systematic variability Systematic variability • Variability among physicians/hospitals that might be explained by hospital-specific characteristics Sampling variability • Statistical uncertainty of physician/hospital-specific performance measures Use MLMs that • Incorporate patient, physician and hospital-level characteristics • Capture all important uncertainties • Produce appropriate statistical summaries BIO656--Multilevel Models
Statistical Challenges Need a valid method of adjusting for case mix and other features • Patient, physician and hospital characteristics • But, beware of over adjustment Need a valid model for stochastic properties • Account for variation at all levels • Account for within-hospital, within-patient correlations Need to • Adjust for systematic variation • Estimate and account for statistical variation BIO656--Multilevel Models
PROPER USE OF STATISTICAL SUMMARIES The challenge • Differences in standard errors of hospital-specific estimates invalidate direct comparisons • In any case, large SEs make comparisons imprecise Consequence • Even after valid case mix adjustment, differences in directly estimated performance are due, in part, to sampling variability (Partial) Solution, use: • Shrinkage estimates to balance and reduce variability • Goal-specific estimates to hit the right target BIO656--Multilevel Models
Comparing performance measures Ranks/percentiles, of: • Direct estimates (MLEs) • Shrunken estimates (BLUPs, Posterior Means) • Z-scores testing H0 that a unit is just like others • Optimal (best) ranks or percentiles Other measures • Probability of a large difference between unit-specific “true” and H0-generated event rates • Probability of “excess mortality” • For the “typical patient, on average or for a specific patient type • Z-score/P-value declarations • .... BIO656--Multilevel Models
USRDS BIO656--Multilevel Models
USRDS BIO656--Multilevel Models
MLE ESTIMATED SMRs & CIs BIO656--Multilevel Models
Poisson-Normal Model(N, Y[k], emort[k]) are inputs model { {prec~dgamma(0.00001,0.00001) for (k in 1:N) { logsmr[k]~dnorm(0,prec) smr[k]<-exp(logsmr[k]) rate[k]<-emort[k]*smr[k] Y[k] ~ dpois(rate[k]) } } Monitor the SMR[k] BIO656--Multilevel Models
MLE, SE & POSTERIOR MEAN SMRs (using a log-normal/Poisson model) SE MLE PM BIO656--Multilevel Models
Posterior Mean: estimated SMRs & CIs using a log-normal/Poisson model (original scale) BIO656--Multilevel Models
Posterior Mean: estimated SMRs & CIs using a Gamma/Poisson model (expanded scale) BIO656--Multilevel Models
Caterpillar Plot (Hofer et al. JAMA 1999) • Estimated relative, physician-specific visit rate and 95% CI • Adjusted for patient demographic and case-mix • (1.0 is the “typical” rate) BIO656--Multilevel Models
Amount that physician-specific, laboratory costs for diabetic • patients deviates from the mean for all physicians [$/(pt. yr.)] • Lines show the path from the direct estimate (the MLE) to the • shrunken estimate (Hofer et al JAMA 1999) DIRECT ADJUSTED BIO656--Multilevel Models
Example using BUGS forhospital performance ranking BIO656--Multilevel Models
BUGS Model specification model { for k in 1:K { b[k]~dnorm(0, prec) r[k]~dbin(p[k], n[k]) logit(p[k]) <- mu + b[k] } pop.mean<-exp(mu + bb)/(1+exp(mu + bb)) mu~dnorm(0, 1E-6) prec~dgamma(.0001,.0001) tausq<-1/prec add~dnorm(0, prec) bb<- mu + add } Monitor the p[k] and ask for ranks BIO656--Multilevel Models
Summary Statistics BIO656--Multilevel Models
Posterior distributions of the ranks BIO656--Multilevel Models
LOS X = (Posterior Mean-Based Ranks) – (Optimal Ranks) = BIO656--Multilevel Models
LOS BIO656--Multilevel Models
Relations among percentiling methods 1998 USRDS Percentiles BIO656--Multilevel Models
BACK TO THE USRDS, SMR EXAMPLE BIO656--Multilevel Models
False detection and non-detection BIO656--Multilevel Models