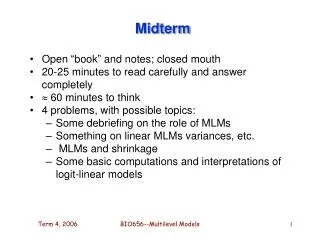
MIDTERM
MIDTERM. A Powerpoint presentation that briefly introduces the planning or policy issue that you have chosen. Your presentation should includes between four and eight different layouts using at least six skills learned during class.

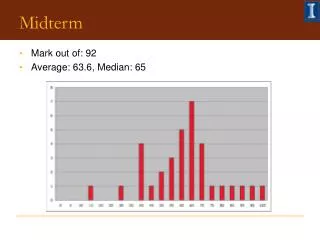
MIDTERM
E N D
Presentation Transcript
MIDTERM A Powerpoint presentation that briefly introduces the planning or policy issue that you have chosen. Your presentation should includes between four and eight different layouts using at least six skills learned during class. Each layout should be somewhat distinct and should display your data in aclearandunclutteredway. Effective graphical representation of data seeks to inform an audience in a clear, simplistic manner. Your layouts will be evaluated on the basis of how well you convey fairly complex data into graphical forms that are both aesthetically pleasing and informative.
Boundaries are important • The “Clip” tool is your friend • Does this look right?
How clip works – the holiday cookie.. • Input = cookie dough • Clip features = cookie cutter • Output = Christmas tree cookie!
Don’t create islands that don’t exist • Use surrounding land features to fill in areas INCORRECT CORRECT
Drop out rates in LAUSD Schools Intro to GIS, Fall 2009
What I DID NOT do • Get crime rates • Successfully teach myself to georeference an image using control points • Keep my sanity
Low income areas are concentrated: • East LA • South LA • The Valley Aggregated field creation: (public assistance+SSI) / Tot. Pop. Map by: Jessica Nolan Map by: Jessica Nolan
Map by: Jessica Nolan Poverty is centralized in the same areas that people receive the most public assistance. • East LA • South LA • The Valley
FINALPOLICY QUESTION: What district-wide, violence prevention policy can LAUSD middle and high schools utilize to help educate students on the skills needed to prevent violence? FIRST WE MUST KNOW • What are the demographics of LAUSD schools? • Where is violence centralized in LA County? • What are the needs of LAUSD students?
Skills • Inset Map: LAUSD Map • Point graduated Symbol: displayed the number of drop outs in LAUSD high schools • Aggregating attribute fields: adding together public assistance and SSI and then dividing by the total pop. Per census tract. • Attribute Subset Selections: selected LAUSD schools from all LA County Schools, selected major Interstates from an LA County roads shape file • Create Indices: Calculated percent of people that receive public assistance • Attribute sub-set selection: Selected City of LA from LA County Places for all maps. Selected interstates from LA County roads for all maps. • Geocoding: Created address locator for LAUSD High Schools and Middle Schools. • Geoprocessing: Clipping: Clipped LAUSD from County of LA school districts, clipped interstates to LA County, Clipped LA County from CA Counties,
How do coastal cities impact beach water quality? Christine M LeeCivil and Environmental Engineering
Santa Monica Bay spans between 50-60 miles of the Los Angeles County coastline.
Heal the Bay regularly monitors 61 beaches in this region (and more if we go farther south)
These coastline communities were defined using a 1 mile buffer; however, visitors often travel much farther than this to access the beach.
Median income and beach bummers across Santa Monica Bay Sources: Census 2000, ESRI, Heal the Bay, City of LA
Questions to ask yourself about your map • During my presentation, how much will I need to explain my map? • Your key point should not require any explanation; it should be apparent to the audience. • Does my inset map effectively put the study area in context? • No new islands! • Do my labels distract from the main point I am trying to show on my map? • Play with the color and size of your text so important labels ‘pop’ while • secondary labels fade into background. • Be picky about what labels and text you include; the image should be your main method of communication, not text! • Does my presentation flow? • Make sure you are using the same graphic ‘language’ from slide to slide • Generally speaking (but not always) your legend, sources, north arrow and other information should be shown in the same area from slide to slide. • Your maps should be able to ‘stand alone’ AND build on each other • throughout the presentation.