Functional Mapping
This study examines the growth dynamics of a rice double haploid (DH) population with contrasting heights (Tall AA vs. Short aa). Utilizing a randomized block design across multiple environments, we model plant height growth using functional mapping techniques. Key parameters include the asymptotic height, growth rate, and developmental landmarks. We focus on inflection points in the growth curve, assessing the influence of significant QTLs on growth parameters such as Pi, P1, and P2 across different growth phases: exponential, linear, and ageing.

Functional Mapping
E N D
Presentation Transcript
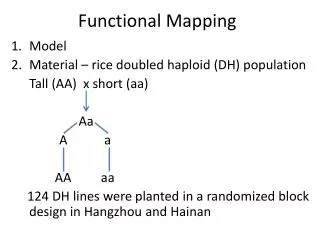
Functional Mapping Model Material – rice doubled haploid (DH) population Tall (AA) x short (aa) Aa A a AA aa 124 DH lines were planted in a randomized block design in Hangzhou and Hainan
g(t) is the plant height; a is the asymptotic value; b is the parameter that describes the initial growth of plant height; r is the relative growth rate; k is the power at which the metabolic rate of an organ scales as the kth power of its weight.
Three developmental landmarks First, Pi, the inflection point of growth curve = Hypothesis tests H0: How to estimate the parameters? H0:
Second, P1, the first inflection point of growth rate curve =
Third, P2, the second inflection point of growth rate curve =
Developmental Processes • Exponential growth (0 to P1) • Linear growth (P1 to P2) • Ageing (P2 to the infinite)
Homework 3 You have analyzed the rice data and obtained significant QTLs. You draw genotypic curves using growth parameters Next, you need to test the genetic effects of the QTL on - Pi, the inflection point of growth curve - P1, the first inflection point of growth rate curve - P2, the second inflection point of growth rate curve - Exponential growth (0 to P1) - Linear growth (P1 to P2) - Ageing (P2 to the infinite)