Download
1 / 1
10 likes | 103 Vues
Explore the use of mark-recapture techniques to estimate student population at Butler University, comparing results to actual data and identifying key challenges and considerations for future studies.

E N D
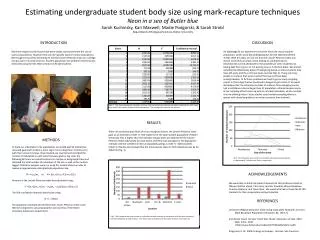
Estimating undergraduate student body size using mark-recapture techniques Neon in a sea of Butler blue Sarah Kuchinsky, Kari Maxwell, Madie Podgorski, & Sarah Strobl Department of Biological Sciences, Butler University INTRODUCTION Mark and recapture techniques have been widely used to estimate the size of various populations, however they are not typically used on human populations. We thought it would be interesting to test the Lincoln-Peterson index on a college campus due to its ease of access. Student population size at Butler University was estimated using the Fall 2010 semester of BI-120 students. DISCUSSION An advantage to our experiment is that we know the actual student population, which was 4100 Undergraduates for Fall 2010 (Enrollment Trend). With this data, we can see that the Lincoln-Peterson index was shown to be fairly accurate, when looking at combined values. Dissimilarities can be attributed to the possibility of some students not having kept their tag on, or not putting one on in the first place. We started sampling the Wednesday before Thanksgiving break; so many students may have left early, and thus not have been counted (Fig. 2). There are many people on campus that were counted that may not have been undergraduates. To fix these problems we tried to get as many sampling events in three days that we could and managed to get a total of 16 events. We believe that the estimated number of students from averaging events had a confidence interval larger than its population estimate because some of our sampling efforts came up with no marked individuals, which resulted in a low dividing factor. Future studies could include sampling efforts in spaces with closed populations at more consistent time intervals. Table 1. This shows population estimate, variance, and the confidence intervals calculated separately for each event to be used in the Lincoln-Peterson Index calculations. The averages are noted in the last row. RESULTS When we combined data from all of our recapture events, the Lincoln-Peterson index gave us an estimate of 3437 +/- 810 students for the total student population of Butler University. This is higher than the estimate we got when we determined the Lincoln-Peterson index individually for each event, and then took averages for the population estimate and the confidence interval separately, giving us 3150 +/- 3426 students (Table 1). Results also showed that the most popular place to find individuals was by far Atherton (Fig. 1). METHODS To mark our individuals in the populations we visited each BI 120 lecture class and gave each student a neon tag to tie to a bag they normally carry with them around campus. Once marked, we counted and recorded the number of individuals in each class that were given a tag. Over the following 48 hours we visited locations on campus at designated times and recorded the total number of individuals at the site as well as the number tagged. Statistical analyses were run using the Lincoln-Peterson index to receive an approximate undergraduate population size: N = n1n2/m2 or N = [(n1+1)( n2 +1)( m2+1)]-1 Variance in the Lincoln-Peterson index was calculated using: s2 =[(n1+1)(n2 +1)(n1 – m2)(n2 – m2)]/[(m2+1)2(m2+2) The 95% confidence intervals were found using: N +/- 1.96(s) The population estimate derived from the Lincoln-Peterson index could then be compared to actual population size courtesy of the Butler University Admissions Department. Fig 2. This shows the total numbers of marked individuals at each location on Wednesday, Thursday, and Friday, respectively. ACKNOWLEDGEMENTS We would like to thank the Butler University BI 120 professors listed as follows: Nathan Hauck, Chris Hess, Jennifer Kowalski, Marva Meadows, Charissa Osborne, and Travis Ryan. We would also like to thank the BI 120 students for their cooperation and participation. REFERENCES American Midland Naturalist. 2010. Using Track-plate Footprints in Fisher MarkRecapture Population Estimation. 64: 165-171 Enrollment Trend, Ten Year Trend. Rep. Butler University, 14 Sept. 2010. Web. 2 Dec. 2010. <http://www.butler.edu/media/1027768/table%201.1.pdf>. Kingsolver, R. W. 2006. Ecology on Campus. Pearson, San Francisco.