Download
1 / 40
400 likes | 571 Vues
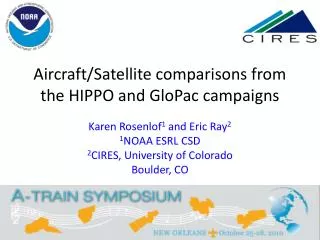
Mulit -species Observations from the first 3 HIPPO Campaigns. Britton Stephens (NCAR EOL) and HIPPO Science Team. PIs: Harvard, NCAR, Scripps, NOAA

E N D
Mulit-species Observations from the first 3 HIPPO Campaigns Britton Stephens (NCAR EOL) and HIPPO Science Team
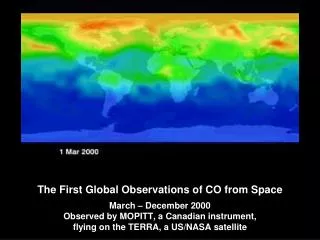
PIs: Harvard, NCAR, Scripps, NOAA • Global and seasonal survey of CO2, O2, CH4, CO, N2O, H2, SF6, COS, CFCs, HCFCs, O3, H2O, CO2 isotopes, Ar, black carbon, and hydrocarbons • NSF / NCAR Gulfstream V • 5 campaigns over 4 years • Continuous profiling from surface to 10 km and to 15 km twice per flight • hippo.ucar.edu (also Facebook, Twitter, YouTube) Canterbury, New Zealand Pago Pago, American Samoa Brooks Range, Alaska
HIPPO_2 Nov 2009 HIPPO_3 Mar/Apr 2010 (same track NB, SB) HIPPO_4 Jun 2011 (NB track via E. Pacific) HIPPO_5 Sep 2011 (NB track NB, SB) ~ 600 vertical profiles; nearly 1000 at HIPPO's conclusion.
Tropical Land and Northern Land fluxes plotted versus annual-mean northern-hemisphere vertical CO2 gradient Continental-scale carbon flux uncertainties are still very large, owing to biases in atmospheric CO2 transport [Stephens et al., 2007]
HIPPO Science Team: Harvard University: S. C. Wofsy, B. C. Daube, R. Jimenez, E. Kort, J. V. Pittman, S. Park, R. Commane, Bin Xiang, G. Santoni; (GEOS-CHEM) D. Jacob, J. Fisher, C. Pickett-Heaps, H. Wang, K. Wecht, Q.-Q. Wang National Center for Atmospheric Research: B. B. Stephens, S. Shertz, P. Romashkin, T. Campos, J. Haggerty, W. A. Cooper, D. Rogers, S. Beaton , R. Lueb NOAA ESRL and CIRES: J. W. Elkins, D. Fahey, R. Gao, F. Moore, S. A. Montzka, J. P. Schwartz, D. Hurst, B. Miller, C. Sweeney, S. Oltmans, D. Nance, E. Hintsa, G. Dutton, L. A. Watts, R. Spackman, K. Rosenlof, E. Ray UCSD/Scripps: R. Keeling, J. Bent Princeton: M. Zondlo, Minghui Diao U. Miami: E. A. Atlas TCCON: Vanessa Sherlock et al. JPL: M. J. Mahoney; (AIRS) M. Chahine, E. Olsen Cooperating modeling groups: ACTM P. Patra, K. Ishijima; GEMS-MACC R. Engelen; TM3/TM5 Sara Mikaloff-Fletcher;
Harvard/Aerodyne - QCLS CO2, CH4, CO, N2O (1 Hz) NCAR AO2 O2:N2 , CO2 (1 Hz) Harvard OMS CO2 CO2 (1 Hz) NOAA CSD O3 O3 (1 Hz) NOAA GMD O3 O3 (1 Hz) NCAR RAF CO CO (1 Hz) NOAA- UCATS, PANTHER GCs (1 per 70 – 200 s) CO, CH4, N2O, CFCs, HCFCs, SF6, CH3Br, CH3Cl, H2, H2O Whole air sampling: NWAS (NOAA), AWAS (Miami), MEDUSA (NCAR/Scripps) O2:N2, CO2, CH4, CO, N2O , other GHGs, CO2 isotopes, Ar/N2, COS, halocarbons, solvent gases, marine emission species, many more Princeton/SWS VCSEL H2O (1 Hz) NOAA SP2 Black Carbon (1 Hz) MTP, wing stores, etc T, P, winds, aerosols, cloud water HIPPO Aircraft Instrumentation
Species measured by PANTHER and UCATS Fred Moore, Eric Hintsa, Dale Hurst, Jim Elkins PANTHER (6-Channel GC): ECD channels: N2O, SF6, CCl2F2 (CFC-12),) CCl3F (CFC-11), and CBrClF2 (halon-1211) injected every 70 seconds, and H2, CH4, CO, CCl4, CH3CCl3 (methyl chloroform) and PAN (peroxyl acetyl nitrate) injected every 140 seconds. The width of a sample load on an ECD channel is only 3 seconds, allowing this data set to correlate well with other fast measurements. MSD channels: The methyl halides CH3I, CH3Br, CH3Cl, the sulfur compounds COS, CS2, the hydrochlorofluorocarbons CHClF2 (HCFC-22), C2H3Cl2F (HCFC-141b), C2H3ClF2 (HCFC-142b), and the hydrofluorocarbon C2H2F4 (HFC-134a) are injected every 180 seconds with 150 seconds sample load width. This data set correlates with a time average of other fast measurements. UCATS: 2-Channel GC: every 70 s (N2O, SF6) or every 140 s (H2, CH4, CO) TDL: 10-second average H2O Photometer: 1-Hz O3
Complete List of Chemical Species Monitored by the Whole Air Sampler (WAS) Elliot Atlas, Ben Miller, Steve Montzka
NCAR Airborne Oxygen Instrument (AO2) System components:
HIPPO Profile at 80 N January 12, 2009
HIPPO Profile at 65 S Southern Ocean O2 outgassing January 20, 2009
Models with detailed simulations of HIPPO Data • Earth Simulator – ACTM CCSR/NIES/FRCGC AGCM • GEOS-CHEM (NASA DAO) Harvard • MACC-GEMS ECMWF Air Quality and Air chemistry model • TM3 (NIWA), TM5 planned Detailed Model results for HIPPO_1: CO2 SF6 C2H6 CO N2O CH4 O3 PAN NOx HCHO BlkC O2 GEOS_C 1 1 1 1 0 1 0 0 0 0 * ACTM 1 1 0 0 1 1 0 0 0 0 MACC 0 0 1 1, Fcst 0 1 1 1 1 1 TM3 1 0 0 0 0 0 0 0 0 0 1
offset 31 ppb HIPPO Obs CH4 ACTM sources and vertical and horizontal transport
HIPPO _1 HIPPO _2 HIPPO_3 Jan 2009 Nov 2009 Apr 2010 Central Pacific HIPPO_1 Eastern Pacific model obs
Profiles over Ocean Arctic Boundary Layer Plume at 23N, 10km Plume RF04, 8km NH Tropical Troposphere
Preliminary APO model comparisons for HIPPO1 January Mean APO from Climatological fluxes in TM3 HIPPO1 APO Observations per meg Fluxes: Mean ocean O2: Gruber et al., 2001 Seasonal ocean O2 and N2: Garcia and Keeling, 2001 Mean ocean N2: Gloor et al., 2001 Seasonal + mean ocean CO2: Takahashi et al., 2009 Fossil-fuel CO2 and O2: CDIAC Atmospheric Potential Oxygen: APO = O2 + 1.1*CO2
Summary and conclusions • HIPPO provides a new type of data for CO2 and GHG studies: global, extremely fine grained, many tracers. • Major transport processes are clearly delineated, some not captured well by models—the warm conveyor belt (intense, persistent, ensemble of small scale processes), Arctic Cold Dome, and Antarctic marine PBL are examples. • Multiple tracers shine a light into the "Modelers' Closet"—quantitatively confront global models with fine scale data (reaction vs. transport time scales). • Source/sink regions are revealed and impacts quantified—N2O in the tropics and Antarctic, marine reactive species. • The data will be completely public as soon as possible, to encourage their use.
CFC-11 Halon-1211 Whole-Air Sampling NWAS / AWAS (E. Atlas, S. Montzka) Mid-Pacific Sample coverage
Ethyne Methyl chloroform Benzene Dichloromethane
Dimethyl Sulfide Carbonyl Sulfide Methyl Nitrate Carbon Disulfide
HIPPO _1 HIPPO _2 HIPPO_3 Jan 2009 Nov 2009 April 2010
HIPPO _1 HIPPO _2 HIPPO_3 Jan 2009 Nov 2009 April 2010 Southbound Northbound