Trophic Ecosystem Models
Trophic Ecosystem Models. Overview. Logistic growth model Lotka volterra predation models Competition models Multispecies production models MSVPA Size structured models LeMans Ecopath Ecosim Atlantis. Logistic growth Verhulst 1838. Lotka and Volterra.

Trophic Ecosystem Models
E N D
Presentation Transcript
Overview • Logistic growth model • Lotkavolterra predation models • Competition models • Multispecies production models • MSVPA • Size structured models LeMans • EcopathEcosim • Atlantis
Lotka and Volterra Volterra, V., “Variazioni e fluttuazioni del numero d’individui in specie animali conviventi”, Mem. Acad. Lincei Roma, 2, 31–113, (1926) Lotka, A.J., Elements of Physical Biology, Williams and Wilkins, (1925)
Lotka (1925) Volterra (1926) W prey numbers L predator numbers r W intrinsic rate of increase e predator predation efficiency m predator natural mortality a predator assimilation efficiency
Biological unrealism of Lotka Volterra • No prey self limitation • No predator self limitation • No limit on prey consumption per predator • Known as functional response
Dynamic behavior These models are either unstable or cyclic
The type II functional response (the disk equation) Na number attacked N number there (density) a’ area searched pc probability of successfully detecting and attacking b handling time
Predator or Prey self limitation • Do we allow for self limitation, or assume that food (in the form of prey eaten) is the only limiting factor?
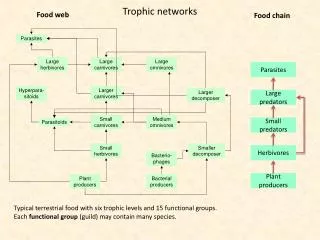
Multispecies Production Models • Biomass dynamics models with trophic interactions • Captures predation effects • Problems: what you eat and who eats you changes through the life history – size or age usually needed to capture this • Switch to simple example in EXCEL
A simple 4 trophic level modelphytoplankton, zooplankton, grazer, piscivore • Phytoplankton bottom up driven • Predation equations for other species
Mpredation = Tkill/Prey Mother = other natural mortality F = fishing mortality Survival = exp(-(Mpredation+Mother+F)) Preyt+1=Preyt*Survival+PreyConsumed*EcotrophicEfficiency
MSVPA • Multi species virtual population analysis • Uses the VPA equation to calculate how much must have been eaten by other species
VPA Back-calculation - I The “terminal” numbers-at-age determine the whole N matrix Oldest-age Ns Most-recent- year Ns (year ymax) Terminal numbers-at-age
VPA Back-calculation - II Given Ny+1,a+1 and Cy,a, Fy,a and Ny,a are calculated as follows: + Find Fy,a from the catch equation, i.e. by solving (using bisection or Newtons method): + Find Ny,a from Ny+1,a+1 and Fy,a :
How MSVPA differs from VPA • Instead of assuming M constant, M depends on how much other species at of prey species • This requires diet composition • Thousands and thousands of stomachs need to be examined!
Simulating MSVPA using MSFOR • What do you assume about diet composition? • Does it change with relative abundance? • Do you allow for a functional response? • What about a spawner recruit relationship?
Size structured models LeMans • Number of individuals by species and size class Nij • Growth parameters to calculate proportion growing between size classes each time interval ϕij proportion moving from i to j • Mortality has three components • Predation accounted for in model M2 • Other natural mortality M1 • Fishing mortality F
Limitations in LeMans • No relation between food availability and growth (or consumption) and survival or recruitment • Thus we can’t use it to examine impact on top predators of reducing their prey • Or bottom up forcing • BUT we can look at impacts of reducing predators on prey species
Ecopath and Ecosim • Switch to Walters Slide show
Atlantis • Wait for lecture from Isaac