Download
1 / 28
280 likes | 378 Vues
Review of probability and statistics concepts, including calculating mean, median, mode, percentile, standard deviation, constructing plots, probability calculations, confidence intervals. Practice problems provided.

E N D
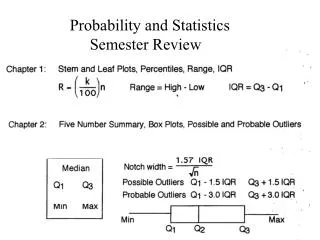
Probability and Statistics Semester Review
Find the mean, median, mode, 5% trimmed mean, • midrange, range, and standard deviation for the data. • What percentile is 23? Where is the 40th percentile? Use the following data for questions 1-4: 12,14,21,23,27,37,39,41,41,43 23 = 3/10 = 30th Percentile P40 = (23+27)/2 = 25
Construct a box and whisker plot. Find the inner quartile range. Label the inner and outer fences. IQR = 41-21 = 01 Inner fences (1.5)*20 = 30 (-9,71) Outer fence (3.0)*20 = 60 (-39, 101) 12 21 32 41 43
3) Construct a histogram for the data using the given class intervals [10, 20), [20, 30). [30, 40), [40, 50) 3 3 2 2 10 20 30 40 50
Construct a frequency curve and ogive. Estimate the mean, standard deviation, the median and the mode. Mode 10 7 3 Median 2 3 3 2 2
How many ways can three cards be chosen for 52? What is the probability that the sum of two six sided dice is less than 6? (1,1) (1,2), (1,3),(1,4) (2,1), (2,2), (2,3) (3,1),(3,2) (4,1)
Shade the following • A U (B C) Ac U B
P(A) =.7, P(B) =.4, P(A B) =.3. Find A B .4 .3 .1 .2 a. P(A U B) b. P(A|B) c. P(Ac) d. P(B|A) e. P(Ac U B) 9) Find the probability of getting at least 3 questions right on a 5 question multiple choice test with four possible answers.
10) If a person is vaccinated properly, the probability of getting the disease is .04. Without the vaccination, the probability of getting the disease is .30. Assume 1/4 of the population is properly vaccinated. a. If a person is selected at random, what is the probability they will get the disease? .01+ .225 = .235 b. If a person gets the disease, what is the probability that they were properly vaccinated? P(V|D) = .01/.235 = .0425
11) The probability that a part is defective is .15. Find the expected value of defective parts and the standard deviation out of a lot of 100 parts. What interval would contain about 68% of the parts? a. Expected value = n p = (100)(.15) = 15 c. 15 + 3.57 (11.43, 18.57)
12) An average for a test is 85 with a standard deviation of 4.2. a. What is the probability that the score is between 81 and 84? .3295 - .0940 = .2355 b. What is the probability that the score is less than 88?
c. What score must be obtained in order to be in the top 10%?
13) The average number of bulls that walk into a barn is 4 each day. a. What is the probability that 6 walk in on a given day? b. What is the probability that more than 2 walk in on any given day?
14) A sample of 20 ACT scores was taken from a random sample. Find a 95% and a 99% confidence interval for . Assume normal distribution. 14,23,20,15,21,31,21,26,27,22,19,22,30,14,16,22,28,29,24,26 99% 22.5 + 2.861(1.16) = (19.18,25.82) 95% 22.5 + 2.091(1.16) = (20.07,24.93)
About 200 baseball players were surveyed. A random sample of n = 40 yields a mean annual income of $1,200,000 and an estimated standard deviation of s = $250,000. Use this information to find an 85% confidence interval. Use Chebyshev's theorem. (Small population, not normally distributed).
16) A poll of 400 voters in Wisconsin found that 210 preferred candidate A and a poll of 300 voters in Minnesota found that 140 preferred Candidate A. Find a 90% confidence intervals for the proportions of all voters who prefer Candidate A. Is there a difference between Wisconsin and Minnesota?
-1.645 1.645 17) In a large population of students, a school claims that the average ACT score is µ = 25. A newspaper disputes this claim and obtains a random sample of 34 students which yields an average of 24.2, and s = 6.2. Conduct a hypothesis test at the 10% level to determine whether there is statistical evidence that the survey is different than the actual population. 3.
18) A random sample of n = 10 prices of CDs gives the following values: $24.19, $21.04, $12.34, $16.07, $19.65, $19.36, $15.99, $15.02, $18.68, $20.60 Conduct a hypothesis test at 10% level of significance to determine whether evidence exists to support the claim that the population mean is more that $19.00. 3. 1.383
19) A test was designed to test student’s ability to learn statistics. Thousands took the test and were divided by sex. A random sample of 50 was chosen from each group. The females had an average of 44 with a standard deviation of s = 2.1 and the males had an average of 45 with a standard deviation of s = 2.3. Construct a 95% confidence interval for the difference in mean test scores of the two populations.
20) The following is a random sample of numbers of people who were hired at a company over the last 10 years.Construct a 70% and 90% confidence interval for the difference in male and female hirings. Perform a hypothesis test at the 5% significance level for the difference between populations. What conclusion can be made? Hiring practices are different at both levels
21) 15 similar students were tested to determine whether they did better after taking the ACT test once. Use the method of matched pair an perform a hypothesis test at the .1 level to determine if scores improved. 1.345
22) Find the correlation coefficient and the line of best fit for the following data: (3,8) (6,10) (8,14) (12,20) (7,12) (15,28) (13,22) (14,29) (16,38) y = 2.1x – 1.8 r = .949
23) The following table shows billions of miles traveled by air, bus, and rail during the last 5 decades. Conduct a hypothesis test at the 10% level of significance to determine whether the data in the table supports the claim that the mode of transportation is not independent of the decade. Observed Expected 13.362