Download
1 / 35
350 likes | 374 Vues
This workshop outlines the analysis of the underlying event at CDF, focusing on jet production and Z-boson events. It discusses the latest studies at CDF corrected to the particle level, extrapolations to the LHC, and QCD data for theory. The discussion includes hard scattering in QCD Monte-Carlo models, lepton-pair production, and exploring charged particle densities in different regions. The workshop also delves into event topologies, such as leading jet and back-to-back jet events. It examines the sensitive regions towards the underlying event and analyzes observables at the particle and detector levels.

E N D
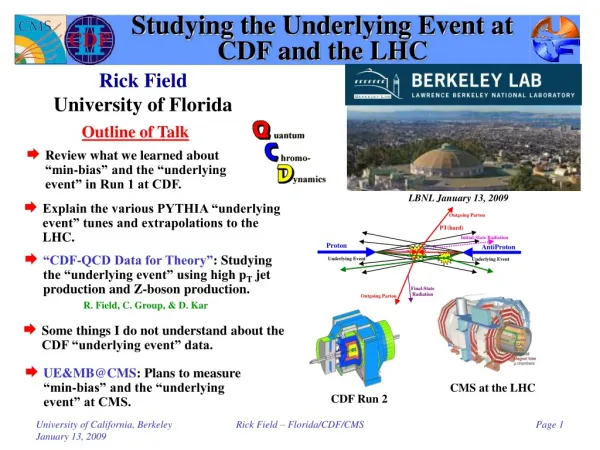
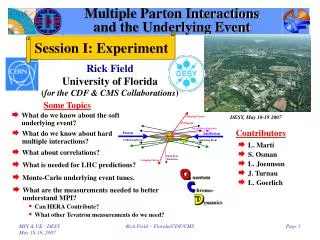
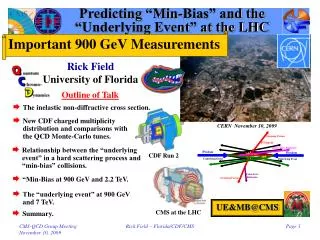
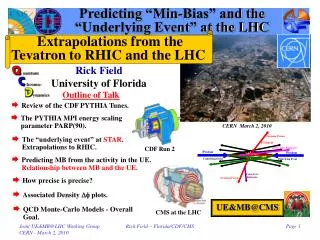
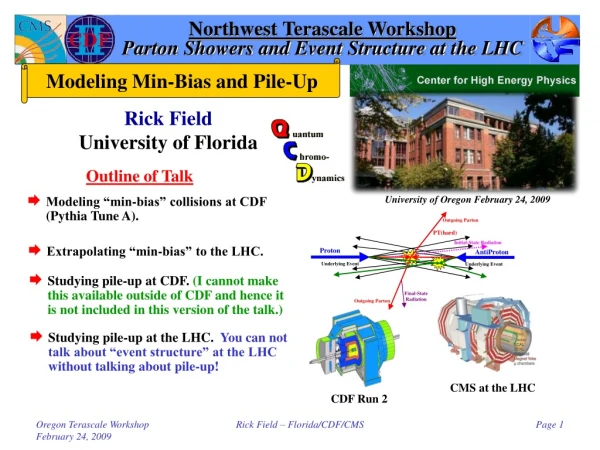
Northwest Terascale WorkshopParton Showers and Event Structure at the LHC Studying the Underlying Event at CDF Rick Field University of Florida Outline of Talk University of Oregon February 24, 2009 • Study “jets” in the “underlying event” (i.e. 3 & 4 jet production). • Show the latest “underlying event” studies at CDF for “leading Jet” and Z-boson events. Data corrected to the particle level. CDF-QCD Data for Theory R. Field, C. Group, & D. Kar • Study <pT> versus <Nchg> in “min-bias” collisions and Z-boson production. CMS at the LHC • Show some extrapolations to the LHC. CDF Run 2 Rick Field – Florida/CDF/CMS
“Hard Scattering” Component QCD Monte-Carlo Models:High Transverse Momentum Jets • Start with the perturbative 2-to-2 (or sometimes 2-to-3) parton-parton scattering and add initial and final-state gluon radiation (in the leading log approximation or modified leading log approximation). “Underlying Event” • The “underlying event” consists of the “beam-beam remnants” and from particles arising from soft or semi-soft multiple parton interactions (MPI). The “underlying event” is an unavoidable background to most collider observables and having good understand of it leads to more precise collider measurements! • Of course the outgoing colored partons fragment into hadron “jet” and inevitably “underlying event” observables receive contributions from initial and final-state radiation. Rick Field – Florida/CDF/CMS
“Hard Scattering” Component QCD Monte-Carlo Models:Lepton-Pair Production • Start with the perturbative Drell-Yan muon pair production and add initial-state gluon radiation (in the leading log approximation or modified leading log approximation). “Underlying Event” • The “underlying event” consists of the “beam-beam remnants” and from particles arising from soft or semi-soft multiple parton interactions (MPI). • Of course the outgoing colored partons fragment into hadron “jet” and inevitably “underlying event” observables receive contributions from initial-state radiation. Rick Field – Florida/CDF/CMS
“Towards”, “Away”, “Transverse” Look at the charged particle density, the charged PTsum density and the ETsum density in all 3 regions! • Look at correlations in the azimuthal angle Df relative to the leading charged particle jet (|h| < 1) or the leading calorimeter jet (|h| < 2). • Define |Df| < 60o as “Toward”, 60o < |Df| < 120o as “Transverse ”, and |Df| > 120o as “Away”. Each of the three regions have area DhDf = 2×120o = 4p/3. Df Correlations relative to the leading jet Charged particles pT > 0.5 GeV/c |h| < 1 Calorimeter towers ET > 0.1 GeV |h| < 1 “Transverse” region is very sensitive to the “underlying event”! Z-Boson Direction Rick Field – Florida/CDF/CMS
Event Topologies • “Leading Jet” events correspond to the leading calorimeter jet (MidPoint R = 0.7) in the region |h| < 2 with no other conditions. “Leading Jet” subset • “Inclusive 2-Jet Back-to-Back” events are selected to have at least two jets with Jet#1 and Jet#2 nearly “back-to-back” (Df12 > 150o) with almost equal transverse energies (PT(jet#2)/PT(jet#1) > 0.8) with no other conditions . “Inc2J Back-to-Back” subset “Exc2J Back-to-Back” • “Exclusive 2-Jet Back-to-Back” events are selected to have at least two jets with Jet#1 and Jet#2 nearly “back-to-back” (Df12 > 150o) with almost equal transverse energies (PT(jet#2)/PT(jet#1) > 0.8) and PT(jet#3) < 15 GeV/c. “Charged Jet” • “Leading ChgJet” events correspond to the leading charged particle jet (R = 0.7) in the region |h| < 1 with no other conditions. • “Z-Boson” events are Drell-Yan events with 70 < M(lepton-pair) < 110 GeV with no other conditions. Z-Boson Rick Field – Florida/CDF/CMS
“transMAX” & “transMIN” • Define the MAX and MIN “transverse” regions (“transMAX” and “transMIN”) on an event-by-event basis with MAX (MIN) having the largest (smallest) density. Each of the two “transverse” regions have an area in h-f space of 4p/6. “transMIN” very sensitive to the “beam-beam remnants”! Z-Boson Direction Area = 4p/6 • The “transMIN” region is very sensitive to the “beam-beam remnant” and the soft multiple parton interaction components of the “underlying event”. • The difference, “transDIF” (“transMAX” minus “transMIN”), is very sensitive to the “hard scattering” component of the “underlying event” (i.e. hard initial and final-state radiation). • The overall “transverse” density is the average of the “transMAX” and “transMIN” densities. Rick Field – Florida/CDF/CMS
Observables at theParticle and Detector Level “Leading Jet” “Back-to-Back” Rick Field – Florida/CDF/CMS
Highest pT particle in the “transverse” region! “Transverse” PTmax versus ET(jet#1) “Leading Jet” “Back-to-Back” Min-Bias • Use the leading jet to define the “transverse” region and look at the maximum pT charged particle in the “transverse” region, PTmaxT. • Shows the average PTmaxT, in the “transverse” region (pT > 0.5 GeV/c, |h| < 1) versus ET(jet#1) for “Leading Jet” and “Back-to-Back” events compared with the average maximum pT particle, PTmax, in “min-bias” collisions (pT > 0.5 GeV/c, |h| < 1). Rick Field – Florida/CDF/CMS
Back-to-Back “Associated”Charged Particle Densities Maximum pT particle in the “transverse” region! “Associated” densities do not include PTmaxT! • Use the leading jet in “back-to-back” events to define the “transverse” region and look at the maximum pT charged particle in the “transverse” region, PTmaxT. • Look at the Df dependence of the “associated” charged particle and PTsum densities, dNchg/dhdf and dPTsum/dhdf for charged particles (pT > 0.5 GeV/c, |h| < 1, not including PTmaxT) relative to PTmaxT. • Rotate so that PTmaxT is at the center of the plot (i.e. 180o). Rick Field – Florida/CDF/CMS
Back-to-Back “Associated”Charged Particle Densities “Associated” densities do not include PTmaxT! Jet#2 Region ?? Log Scale! • Look at the Df dependence of the “associated” charged particle density, dNchg/dhdf for charged particles (pT > 0.5 GeV/c, |h| < 1, not including PTmaxT) relative to PTmaxT (rotated to 180o) for PTmaxT > 0.5 GeV/c, PTmaxT > 1.0 GeV/c and PTmaxT > 2.0 GeV/c, for “back-to-back” events with 30 < ET(jet#1) < 70 GeV. • Shows “jet structure” in the “transverse” region (i.e.the “birth” of the 3rd & 4th jet). Rick Field – Florida/CDF/CMS
“Back-to-Back” vs “Min-Bias”“Associated” Charge Density “Birth” of jet#3 in the “transverse” region! “Back-to-Back” “Associated” Density “Min-Bias” “Associated” Density Log Scale! “Birth” of jet#1 in “min-bias” collisions! • Shows the Df dependence of the “associated” charged particle density, dNchg/dhdf for pT > 0.5 GeV/c, |h| < 1 (not including PTmaxT) relative to PTmaxT (rotated to 180o) for PTmaxT > 2.0 GeV/c, for “back-to-back” events with 30 < ET(jet#1) < 70 GeV. • Shows the data on the Df dependence of the “associated” charged particle density, dNchg/dhdf, pT > 0.5 GeV/c, |h| < 1 (not including PTmax) relative to PTmax (rotated to 180o) for “min-bias” eventswith PTmax > 2.0 GeV/c. Rick Field – Florida/CDF/CMS
0.5 1.0 1.5 2.0 Back-to-Back “Associated”Charged Particle Densities “Back-to-Back” charge density “Back-to-Back” “associated” density Polar Plot • Shows the Df dependence of the “associated” charged particle density, dNchg/dhdf, pT > 0.5 GeV/c, |h| < 1 (not including PTmaxT) relative to PTmaxT (rotated to 180o) and the charged particle density, dNchg/dhdf, pT > 0.5 GeV/c, |h| < 1 relative to jet#1 (rotated to 270o) for “back-to-back events” with 30 < ET(jet#1) < 70 GeV. Rick Field – Florida/CDF/CMS
0.5 1.0 1.5 2.0 Back-to-Back “Associated”Charged Particle Densities “Back-to-Back” charge density “Back-to-Back” “associated” density Polar Plot • Shows the Df dependence of the “associated” charged particle density, dNchg/dhdf, pT > 0.5 GeV/c, |h| < 1, PTmaxT > 2.0 GeV/c (not including PTmaxT) relative to PTmaxT (rotated to 180o) and the charged particle density, dNchg/dhdf, pT > 0.5 GeV/c, |h| < 1, relative to jet#1 (rotated to 270o) for “back-to-back events” with 30 < ET(jet#1) < 70 GeV. Rick Field – Florida/CDF/CMS
0.5 1.0 1.5 2.0 Jet Topologies QCD Four Jet Topology QCD Three Jet Topology Polar Plot • Shows the Df dependence of the “associated” charged particle density, dNchg/dhdf, pT > 0.5 GeV/c, |h| < 1, PTmaxT > 2.0 GeV/c (not including PTmaxT) relative to PTmaxT (rotated to 180o) and the charged particle density, dNchg/dhdf, pT > 0.5 GeV/c, |h| < 1, relative to jet#1 (rotated to 270o) for “back-to-back events” with 30 < ET(jet#1) < 70 GeV. Rick Field – Florida/CDF/CMS
“Associated” PTsum DensityPYTHIA Tune A vs HERWIG HERWIG (without multiple parton interactions) does not produce enough “associated” PTsum in the direction of PTmaxT! PTmaxT > 0.5 GeV/c And HERWIG (without multiple parton interactions) does not produce enough PTsum in the direction opposite of PTmaxT! Rick Field – Florida/CDF/CMS
For PTmaxT > 2.0 GeV both PYTHIA and HERWIG produce slightly too much “associated” PTsum in the direction of PTmaxT! “Associated” PTsum DensityPYTHIA Tune A vs HERWIG PTmaxT > 2 GeV/c But HERWIG (without multiple parton interactions) produces too few particles in the direction opposite of PTmaxT! Rick Field – Florida/CDF/CMS
Jet Multiplicity • Shows the data on the number of jets (JetClu, R = 0.7, |h| < 2, ET(jet) > 3 GeV) for “back-to-back” events with 30 < ET(jet#1) < 70 GeV andPTmaxT > 2.0 GeV/c. Max pT in the “transverse” region! HERWIG (without multiple parton interactions) does not have equal amounts of 3 and 4 jet topologies! Data have about equal amounts of 3 and 4 jet topologies! • Compares the (uncorrected) data with PYTHIA Tune A after CDFSIM. • Compares the (uncorrected) data with HERWIG after CDFSIM. Rick Field – Florida/CDF/CMS
Overall Totals (|h| < 1) ETsum = 775 GeV! • Data at 1.96 TeV on the overall number of charged particles (pT > 0.5 GeV/c, |h| < 1) and the overall scalar pT sum of charged particles (pT > 0.5 GeV/c, |h| < 1) and the overall scalar ET sum of all particles (|h| < 1) for “leading jet” events as a function of the leading jet pT. The data are corrected to the particle level (with errors that include both the statistical error and the systematic uncertainty) and are compared with PYTHIA Tune A at the particle level (i.e. generator level).. “Leading Jet” ETsum = 330 GeV PTsum = 190 GeV/c Nchg = 30 Rick Field – Florida/CDF/CMS
“Towards”, “Away”, “Transverse” • Data at 1.96 TeV on the density of charged particles, dN/dhdf, with pT > 0.5 GeV/c and |h| < 1 for “leading jet” events as a function of the leading jet pT for the “toward”, “away”, and “transverse” regions. The data are corrected to the particle level (with errors that include both the statistical error and the systematic uncertainty) and are compared with PYTHIA Tune A at the particle level (i.e. generator level). “Leading Jet” Factor of ~13 Factor of ~16 Factor of ~4.5 • Data at 1.96 TeV on the charged particle scalar pT sum density, dPT/dhdf, with pT > 0.5 GeV/c and |h| < 1 for “leading jet” events as a function of the leading jet pT for the “toward”, “away”, and “transverse” regions. The data are corrected to the particle level (with errors that include both the statistical error and the systematic uncertainty) and are compared with PYTHIA Tune A at the particle level (i.e. generator level). • Data at 1.96 TeV on the particle scalar ET sum density, dET/dhdf, for |h| < 1 for “leading jet” events as a function of the leading jet pT for the “toward”, “away”, and “transverse” regions. The data are corrected to the particle level (with errors that include both the statistical error and the systematic uncertainty) and are compared with PYTHIA Tune A at the particle level (i.e. generator level). Rick Field – Florida/CDF/CMS
Charged Particle Density HERWIG + JIMMY Tune (PTJIM = 3.6) H. Hoeth, MPI@LHC08 • Data at 1.96 TeV on the density of charged particles, dN/dhdf, with pT > 0.5 GeV/c and |h| < 1 for “Z-Boson” and “Leading Jet” events as a function of the leading jet pT or PT(Z) for the “toward”, “away”, and “transverse” regions. The data are corrected to the particle level (with errors that include both the statistical error and the systematic uncertainty) and are compared with PYTHIA Tune AW and Tune A, respectively, at the particle level (i.e. generator level). Rick Field – Florida/CDF/CMS
Charged PTsum Density • Data at 1.96 TeV on the charged scalar PTsum density, dPT/dhdf, with pT > 0.5 GeV/c and |h| < 1 for “Z-Boson” and “Leading Jet” events as a function of the leading jet pT or PT(Z) for the “toward”, “away”, and “transverse” regions. The data are corrected to the particle level (with errors that include both the statistical error and the systematic uncertainty) and are compared with PYTHIA Tune AW and Tune A, respectively, at the particle level (i.e. generator level). Rick Field – Florida/CDF/CMS
The “TransMAX/MIN” Regions • Data at 1.96 TeV on the charged particle density, dN/dhdf, with pT > 0.5 GeV/c and |h| < 1 for “Z-Boson” and “Leading Jet” events as a function of PT(Z) or the leading jet pT for the “transMAX”, and “transMIN” regions. The data are corrected to the particle level (with errors that include both the statistical error and the systematic uncertainty) and are compared with PYTHIA Tune AW and Tune A, respectively, at the particle level (i.e. generator level). • Data at 1.96 TeV on the density of charged particles, dN/dhdf, with pT > 0.5 GeV/c and |h| < 1 for “leading jet” events as a function of the leading jet pT and for Z-Boson events as a function of PT(Z) for “TransDIF” =“transMAX” minus “transMIN” regions. The data are corrected to the particle level (with errors that include both the statistical error and the systematic uncertainty) and are compared with PYTHIA Tune A and HERWIG (without MPI) at the particle level (i.e. generator level). Rick Field – Florida/CDF/CMS
The “TransMAX/MIN” Regions • Data at 1.96 TeV on the charged scalar PTsum density, dPT/dhdf, with pT > 0.5 GeV/c and |h| < 1 for “Z-Boson” and “Leading Jet” events as a function of PT(Z) or the leading jet pT for the “transMAX”, and “transMIN” regions. The data are corrected to the particle level (with errors that include both the statistical error and the systematic uncertainty) and are compared with PYTHIA Tune AW and Tune A, respectively, at the particle level (i.e. generator level). • Data at 1.96 TeV on the charged scalar PTsum density, dPT/dhdf, with pT > 0.5 GeV/c and |h| < 1 for “leading jet” events as a function of the leading jet pT and for Z-Boson events as a function of PT(Z) for “TransDIF” =“transMAX” minus “transMIN” regions. The data are corrected to the particle level (with errors that include both the statistical error and the systematic uncertainty) and are compared with PYTHIA Tune A and HERWIG (without MPI) at the particle level (i.e. generator level). Rick Field – Florida/CDF/CMS
Charged Particle <pT> H. Hoeth, MPI@LHC08 • Data at 1.96 TeV on the charged particle average pT, with pT > 0.5 GeV/c and |h| < 1 for the “toward” region for “Z-Boson” and the “transverse” region for “Leading Jet” events as a function of the leading jet pT or PT(Z). The data are corrected to the particle level (with errors that include both the statistical error and the systematic uncertainty) and are compared with PYTHIA Tune AW and Tune A, respectively, at the particle level (i.e. generator level). The Z-Boson data are also compared with PYTHIA Tune DW, the ATLAS tune, and HERWIG (without MPI) Rick Field – Florida/CDF/CMS
Z-Boson: “Towards”, Transverse”, & “TransMIN” Charge Density H. Hoeth, MPI@LHC08 • Data at 1.96 TeV on the density of charged particles, dN/dhdf, with pT > 0.5 GeV/c and |h| < 1 for “Z-Boson” events as a function of PT(Z) for the “toward” and “transverse” regions. The data are corrected to the particle level (with errors that include both the statistical error and the systematic uncertainty) and are compared with PYTHIA Tune AW and HERWIG (without MPI) at the particle level (i.e. generator level). Rick Field – Florida/CDF/CMS
Z-Boson: “Towards”, Transverse”, & “TransMIN” Charge Density H. Hoeth, MPI@LHC08 • Data at 1.96 TeV on the charged scalar PTsum density, dPT/dhdf, with pT > 0.5 GeV/c and |h| < 1 for “Z-Boson” events as a function of PT(Z) for the “toward” and “transverse” regions. The data are corrected to the particle level (with errors that include both the statistical error and the systematic uncertainty) and are compared with PYTHIA Tune AW and HERWIG (without MPI) at the particle level (i.e. generator level). Rick Field – Florida/CDF/CMS
DWT Z-Boson: “Towards” Region • Data at 1.96 TeV on the density of charged particles, dN/dhdf, with pT > 0.5 GeV/c and |h| < 1 for “Z-Boson” events as a function of PT(Z) for the “toward” region. The data are corrected to the particle level (with errors that include both the statistical error and the systematic uncertainty) and are compared with PYTHIA Tune AW and HERWIG (without MPI) at the particle level (i.e. generator level). HW without MPI Rick Field – Florida/CDF/CMS
DWT Z-Boson: “Towards” Region • Data at 1.96 TeV on the average pT of charged particles with pT > 0.5 GeV/c and |h| < 1 for “Z-Boson” events as a function of PT(Z) for the “toward” region. The data are corrected to the particle level (with errors that include both the statistical error and the systematic uncertainty) and are compared with PYTHIA Tune AW and HERWIG (without MPI) at the particle level (i.e. generator level). HW (without MPI) almost no change! Rick Field – Florida/CDF/CMS
Min-Bias Correlations New • Data at 1.96 TeV on the average pT of charged particles versus the number of charged particles (pT > 0.4 GeV/c, |h| < 1) for “min-bias” collisions at CDF Run 2. The data are corrected to the particle level and are compared with PYTHIA Tune A at the particle level (i.e. generator level). Rick Field – Florida/CDF/CMS
Min-Bias: Average PT versus Nchg • Beam-beam remnants (i.e. soft hard core) produces low multiplicity and small <pT> with <pT> independent of the multiplicity. • Hard scattering (with no MPI) produces large multiplicity and large <pT>. • Hard scattering (with MPI) produces large multiplicity and medium <pT>. This observable is sensitive to the MPI tuning! = + + The CDF “min-bias” trigger picks up most of the “hard core” component! Rick Field – Florida/CDF/CMS
Average PT versus Nchg • Data at 1.96 TeV on the average pT of charged particles versus the number of charged particles (pT > 0.4 GeV/c, |h| < 1) for “min-bias” collisions at CDF Run 2. The data are corrected to the particle leveland are compared with PYTHIA Tune A, Tune DW, and the ATLAS tune at the particle level (i.e. generator level). • Particle level predictions for the average pT of charged particles versus the number of charged particles (pT > 0.5 GeV/c, |h| < 1, excluding the lepton-pair) for for Drell-Yan production (70 < M(pair) < 110 GeV) at CDF Run 2. Rick Field – Florida/CDF/CMS
Average PT versus Nchg No MPI! • Z-boson production (with low pT(Z) and no MPI) produces low multiplicity and small <pT>. • High pT Z-boson production produces large multiplicity and high <pT>. • Z-boson production (with MPI) produces large multiplicity and medium <pT>. = + + Rick Field – Florida/CDF/CMS
Average PT(Z) versus Nchg No MPI! • Predictions for the average PT(Z-Boson) versus the number of charged particles (pT > 0.5 GeV/c, |h| < 1, excluding the lepton-pair) for for Drell-Yan production (70 < M(pair) < 110 GeV) at CDF Run 2. • Data on the average pT of charged particles versus the number of charged particles (pT > 0.5 GeV/c, |h| < 1, excluding the lepton-pair) for for Drell-Yan production (70 < M(pair) < 110 GeV) at CDF Run 2. The data are corrected to the particle level and are compared with various Monte-Carlo tunes at the particle level (i.e. generator level). Rick Field – Florida/CDF/CMS
Average PT versus Nchg PT(Z) < 10 GeV/c No MPI! Remarkably similar behavior! Perhaps indicating that MPI playing an important role in both processes. • Predictions for the average pT of charged particles versus the number of charged particles (pT > 0.5 GeV/c, |h| < 1, excluding the lepton-pair) for for Drell-Yan production (70 < M(pair) < 110 GeV, PT(pair) < 10 GeV/c) at CDF Run 2. • Data the average pT of charged particles versus the number of charged particles (pT > 0.5 GeV/c, |h| < 1, excluding the lepton-pair) for for Drell-Yan production (70 < M(pair) < 110 GeV, PT(pair) < 10 GeV/c) at CDF Run 2. The data are corrected to the particle level and are compared with various Monte-Carlo tunes at the particle level (i.e. generator level). Rick Field – Florida/CDF/CMS
Summary • It is important to produce a lot of plots (corrected to the particle level) so that the theorists can tune and improve the QCD Monte-Carlo models. If they improve the “transverse” region they might miss-up the “toward” region etc.. We need to show the whole story! • We are making good progress in understanding and modeling the “underlying event”. However, we do not yet have a perfect fit to all the features of the CDF “underlying event” data! CDF Run 2 publication should be out soon! • There are over 128 plots to get “blessed” and then published. So far we have only looked at average quantities. We plan to also produce distributions and flow plots CDF-QCD Data for Theory • I will construct a “CDF-QCD Data for Theory” WEBsite with the “blessed” plots together with tables of the data points and errors so that people can have access to the results . UE&MB@CMS • Need to measure “Min-Bias” and the “underlying event” at the LHC as soon as possible and tune the Monte-Carlo modles and compare with CDF! Rick Field – Florida/CDF/CMS