1 / 1

Scatter Plot of Positive Predictive Value (PPV) from Analyzed Systems in the Corpus

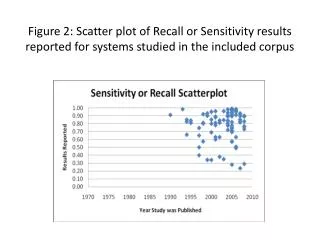
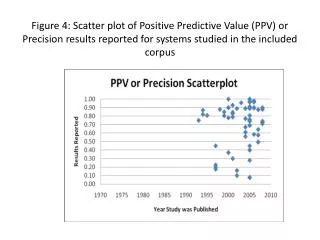
This figure illustrates the scatter plot representation of the Positive Predictive Value (PPV), also known as precision, for the various systems studied in our research corpus. Each data point on the scatter plot corresponds to a specific system’s performance, highlighting the variability and effectiveness in predicting positive outcomes. By analyzing the PPV of these systems, we can gain insights into their reliability and accuracy, which are crucial for assessing their overall effectiveness in various applications.

Télécharger la présentation

Scatter Plot of Positive Predictive Value (PPV) from Analyzed Systems in the Corpus

An Image/Link below is provided (as is) to download presentation Download Policy: Content on the Website is provided to you AS IS for your information and personal use and may not be sold / licensed / shared on other websites without getting consent from its author. Content is provided to you AS IS for your information and personal use only. Download presentation by click this link. While downloading, if for some reason you are not able to download a presentation, the publisher may have deleted the file from their server. During download, if you can't get a presentation, the file might be deleted by the publisher.

E N D

Presentation Transcript


  1. Figure 4: Scatter plot of Positive Predictive Value (PPV) or Precision results reported for systems studied in the included corpus

More Related