
Uploaded by
marny-cook
1 SLIDES
180 VUES
10LIKES
fig4
DESCRIPTION
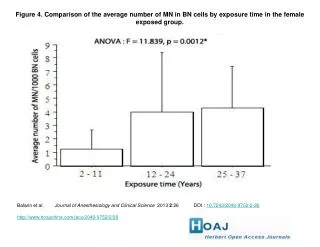
Figure 4. Comparison of the average number of MN in BN cells by exposure time in the female exposed group. Balarin et al. Journal of Anesthesiology and Clinical Science 2013 2 :26 DOI : 10.7243/2049-9752-2-26 http://www.hoajonline.com/jacs/2049-9752/2/26.
Download
1 / 1
Download Presentation

Télécharger la présentation
fig4
An Image/Link below is provided (as is) to download presentation
Download Policy: Content on the Website is provided to you AS IS for your information and personal use and may not be sold / licensed / shared on other websites without getting consent from its author.
Content is provided to you AS IS for your information and personal use only.
Download presentation by click this link.
While downloading, if for some reason you are not able to download a presentation, the publisher may have deleted the file from their server.
During download, if you can't get a presentation, the file might be deleted by the publisher.
E N D
Presentation Transcript
Figure 4. Comparison of the average number of MN in BN cells by exposure time in the female exposed group. Balarin et al. Journal of Anesthesiology and Clinical Science 2013 2:26 DOI : 10.7243/2049-9752-2-26 http://www.hoajonline.com/jacs/2049-9752/2/26

More Related
Audio
Live Player