Download
1 / 1
10 likes | 174 Vues
Statistical Analysis of S-Pol Polarimetric Radar Data from NAME 2004 Timothy J. Lang, Robert Cifelli, Steven A. Rutledge, Angela Rowe, and Lee Nelson Colorado State University, Fort Collins, CO. P8A.7. 1. Overview. 3. Statistical Results. 4. Diurnal Cycle Results.

E N D
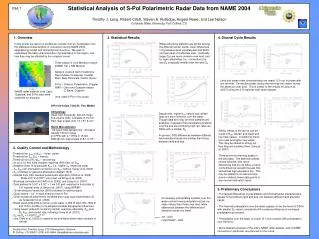
Statistical Analysis of S-Pol Polarimetric Radar Data from NAME 2004 Timothy J. Lang, Robert Cifelli, Steven A. Rutledge, Angela Rowe, and Lee Nelson Colorado State University, Fort Collins, CO P8A.7 1. Overview 3. Statistical Results 4. Diurnal Cycle Results In this poster we report on preliminary results from an investigation into the statistical characteristics of convection during NAME 2004, emphasizing rainfall and microphysical structure. We seek to understand the basic characteristics of precipitation in this region, and how they may be affected by the complex terrain. While reflectivity statistics are similar among the different terrain bands, clear differences in D0 between land (coastal plain and SMO) and sea (Gulf of California) exist. Generally, larger D0s are more common over land, and for high reflectivities (i.e., convection) the sea D0 is typically smaller than the land D0. Three radars in core Monsoon region (NAME Tier I; NW Mexico) Network covered Gulf of California, Sierra Madre Occidental, Coastal Plain, Baja Peninsula, Pacific Ocean S-Pol – S-Band, Polarimetric, Doppler SMN – Cabo and Guasave radars (C-Band, Doppler) (only used S-Pol in this study) Land and ocean radar characteristics are nearly 12 h out of phase with one another. Convection peaks during the morning over water, during the afternoon over land. This is similar to the results of Lang et al. (2007) using the 2-D regional multi-radar dataset. NAME radar network (only Cabo, Guasave, and S-Pol data were available for analysis) S-Pol 24-h Ops 7/8-8/21; Two Modes Climatology Used most frequently; 200-km range Full-volume 360s, complete in 15 min Rain-map angles (0.8,1.3,1.8°) & 0.0° Storm Microphysics ~90 hours total spread over ~35 cases Usually 150-km range 2-3 PPIs with 0-1 RHIs in 15 min 360s @ rain-map angles (0.8,1.3,1.8°) Despite this, higher KDP values and rainfall rates are more common over the water. Though data are noisy and few samples are available, it appears that precipitating systems over the sea are producing high rain rates via DSDs with a smaller D0. In general, DSD differences between different land elevation bands are smaller than those between land and sea. Similar trends to the above can be found in KDP, rainfall, and liquid and ice mass values. Conditional mean rain rates are higher over water. This may be related to strong but less frequent systems there (Lang et al. 2007). There are minor morning peaks in the land data. The afternoon peaks mostly coincide, with minor differences that do not follow a trend (sometimes low elevations peak first, sometimes high elevations do). This may be related to increased noise due to relatively fewer data points in any one land elevation band. 2. Quality Control and Methodology • Threshold on HV, (DP) – noise, clutter • Threshold on ZH, ZDR – insects • Threshold on LDR, DP – second trip • 21-pt (3.15 km) finite impulse response (FIR) filter on DP • Adaptive linear fit to calculate KDP (i.e., higher ZH, fewer pts used) • ZH, ZDR rain attenuation correction via DP method (Carey et al. 2000) • ZH corrected for gaseous attenuation (Battan 1973) • Rainfall from CSU blended polarimetric algorithm (Cifelli et al. 2002) (Base Z-R: Z=133R1.5 pol-tuned via Bringi et al. 2004) • Blockage corrected via Cifelli et al. (2002) and Lang et al. (2007) • Data gridded to 0.02° x 0.02° x 1 km 3-D grid, matched in horizontal to 2-D regional grids of Lang et al. (2007), using SPRINT • 15-min temporal resolution (3818 volumes for entire project) • Grids extend ~1.6° in each direction from S-Pol • Grids include all polarimetric variables plus fuzzy-logic hydrometeor ID via Tessendorf et al. (2005) • Break down gridpoints by terrain (over water, 0-500 m land, 500-1500 m, and 1500+ m MSL) to investigate possible topographic influences • Using lowest gridpoint containing rainfall, examine reflectivity, ZDR and D0, KDP, and rainfall rate, following Carey et al. (2001) • D0 via D0 = 1.529*(ZDR)0.467 • Use Cifelli et al. (2002) to examine ice and liquid water mass contents in vertical 5. Preliminary Conclusions • The largest differences in precipitation and microphysical characteristics appear to be between land and sea, not between different land elevation bands. • The heaviest precipitation over the water appears to be the result of DSDs with smaller D0 values, consistent with a reduced influence of ice-based precipitation processes. • Precipitation over the water is nearly 12 h out of phase with precipitation over the land. • More detailed analyses of the entire NAME radar dataset, and of NAME convection in particular, are planned for the future. On average, precipitating systems over the water contain lower precipitation-sized ice mass values than those over land, while differences between the different land elevation bands are small. Ice - solid Liquid water - dash Contact Info: Timothy Lang, CSU Atmospheric Science, Ft Collins, CO 80523; (970) 491-6944, tlang@atmos.colostate.edu