Linkage and Crossing over
590 likes | 3.23k Vues
Linkage and Crossing over. Lecture 5 Dr. Attya Bhatti. Linkage. Linkage is defined genetically as the failure of two genes to assort independently. Linkage occurs when two genes are close to each other on the same chromosome.

Linkage and Crossing over
E N D
Presentation Transcript
Linkage and Crossing over Lecture 5 Dr. AttyaBhatti
Linkage • Linkage is defined genetically as the failure of two genes to assort independently. • Linkage occurs when two genes are close to each other on the same chromosome. • Genes far apart on the same chromosome assort independently: they are not linked. • Linkage is based on the frequency of crossing over between the two genes.
Discovery of linkage • In the early 1900s, William Bateson and R. C. Punnett studied two genes: one affecting flower color (P, purple, and p, red) and the other affecting the shape of pollen grains (L, long, and l, round). • They crossed pure lines P/P · L/L (purple, long) × p/p · l/l (red, round), and selfed the F1P/p · L/l heterozygotes to obtain an F2. • The F2 phenotypes deviated strikingly from the expected 9:3:3:1 ratio.
Table: Sweet Pea Phenotypes Observed in the F2 by Bateson and Punnett.
Researchers thought that physical coupling between the dominant alleles P and L and between the recessive alleles p and l might have prevented their independent assortment in the F1. • Later, Thomas Hunt Morgan found a similar deviation from Mendel’s second law while studying two autosomal genes in Drosophila. • Morgan suggested that the genes governing both phenotypes are located on the same pair of homologous chromosomes.
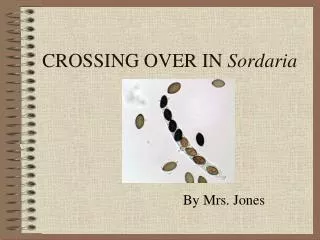
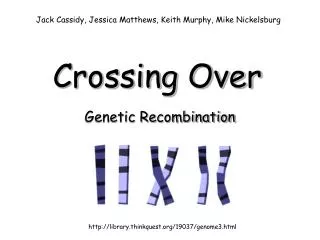
Crossing over • Morgan suggested that, when homologous chromosomes pair in meiosis, the chromosomes occasionally exchange parts in a process called crossing-over.
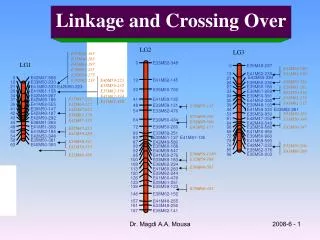
Linkage groups • A group of genes known to be linked; on a chromosome are called linkage groups.
Linkage Symbolism • Each line represents a chromosome; the alleles above are on one chromosome, and those below are on the other chromosome. • A crossover is represented by placing an X between the two chromosomes. • A wild-type allele is written with a plus sign. • Linked genes are designate as ab/ab, never ab/ba.
Linkage Symbolism • Genes known to be on different chromosome pairs are shown separated by a semicolon, for example, A/a ; B/b. • Genes of unknown linkage are shown separated by a dot, A/a · B/b.
Linkage of genes on the X chromosome • The genotype of the gamete that a mother contributes to her son is the sole determinant of the son’s phenotype. • For Example; • We use here the following symbols: y and y+ for the alleles governing yellow body and brown body, respectively; w and w+ for alleles for white eye and red eye; and Y for the Y chromosome.
Linkage of genes on the X chromosome • In the F1 the numbers of males in the phenotypic classes are: • The total frequency of the recombinants will be; (43 + 22) ÷ 14513 = 1.4 percent.
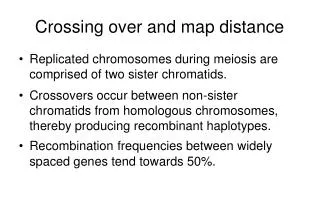
Linkage maps • The amount of crossing-over between various linked genes is different. • Morgan thought that these variations in crossover frequency might somehow indicate the actual distances separating genes on the chromosomes. • percentage of recombinants can be used as a quantitative index of the linear distance between two genes on a genetic map, or called linkage map.
Linkage maps • If two specific genes positioned a certain fixed distance apart. • In some meiotic divisions, nonsister chromatids cross over by chance in the chromosomal region between these genes; from these meioses, recombinants are produced. • In other meiotic divisions, there are no crossovers between these genes; no recombinants result from these meioses.
Linkage maps • Sturtevant postulated a rough proportionality: • The greater the distance between the linked genes, the greater the chance that nonsister chromatids would cross over in the region between the genes and, hence, the greater the proportion of recombinants that would be produced. • Thus, by determining the frequency of recombinants, we can obtain a measure of the map distance between the genes.
Linkage maps The two genes T and U are farther apart on a chromosome than V and W. Chromatids cross over between T and U in a larger proportion of meioses than between V and W, so the recombinant frequency for T and U is higher than that for V and W.
Linkage maps • One genetic map unit (m.u.) is the distance between genes for which one percent of the products of meiosis are recombinant. Or • Recombinant frequency (RF) of 0.01 (1 percent) is defined as 1 m.u. • A map unit is also referred to as a centimorgan (cM) in honor of Thomas Hunt Morgan.]
Linkage maps The place on the map and on the chromosome where a gene is located is called the gene locus (plural, loci).