Download
1 / 19
200 likes | 298 Vues
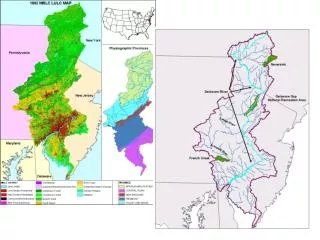
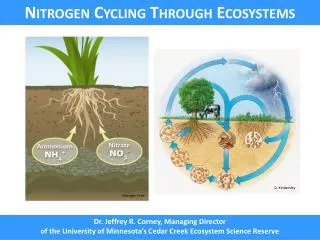
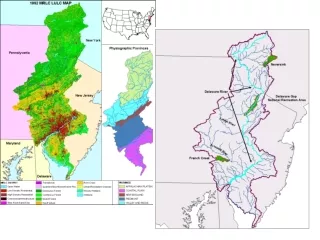
Explore relationships between stressors, forests, and aquatic systems in Neversink Watershed, focusing on nitrogen deposition, cations in streams, and calcium levels in soil and foliage. Understand how stressors affect forest ecosystems and watersheds. Analyze indicator values using GIS and analytical models for ecologically-meaningful thresholds.

E N D
Relationships Among Stressors, Forests, and Aquatic Systems*As Number and Severity of Stressors Increase,The Impacts to Forests and Associated Aquatic Systems Increase
Relationships between Cations in Streams and Forest Health Indicators
Neversink Watershed Calcium in Soil and Foliage of Yellow Birch and Sugar Maple, and levels of Putresine in Foliage
Phase 4 Plots --probability estimate for entire watershed Phase 5 Plots --deliberately co-located with process studies
Phase 4 PlotsNeversink Watershed--20010-10 cm Mineral Soils pH or % Cmolc/kg pH (water) Percent Total Carbon Percent Total Nitrogen ECEC
Hypothetical Relationships among P4 + P5 Indicators and Steam Condition
Since Thresholds for Water Quality, for Human Consumption and Aquatic Life, have been Established, they can be used toDetermine Thresholds for P4 and P5 Indicators.By use of GIS and Analytical Models, the Indicator Values observed on P2 and P3 Plots can beAnalyzed using Ecologically-Meaningful Thresholds