Download
1 / 1
10 likes | 17 Vues
The Effects of Atmospheric Inorganic Nitrogen Deposition on Ocean Biogeochemistry Aparna Krishnamurthy, J.Keith Moore, Chao Luo, Charles S. Zender, Email: aparnak@uci.edu, University of California, Irvine (UCI), Dept. of Earth System Science, Irvine, California.

E N D
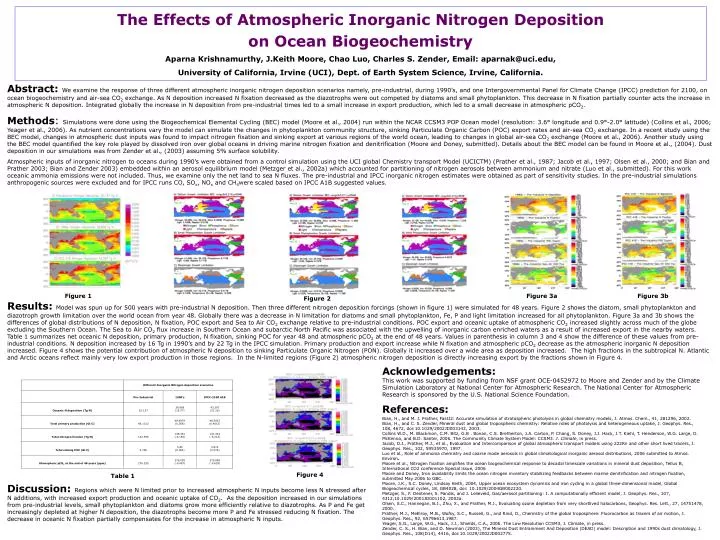
The Effects of Atmospheric Inorganic Nitrogen Deposition on Ocean Biogeochemistry Aparna Krishnamurthy, J.Keith Moore, Chao Luo, Charles S. Zender, Email: aparnak@uci.edu, University of California, Irvine (UCI), Dept. of Earth System Science, Irvine, California. Abstract: We examine the response of three different atmospheric inorganic nitrogen deposition scenarios namely, pre-industrial, during 1990’s, and one Intergovernmental Panel for Climate Change (IPCC) prediction for 2100, on ocean biogeochemistry and air-sea CO2 exchange. As N deposition increased N fixation decreased as the diazotrophs were out competed by diatoms and small phytoplankton. This decrease in N fixation partially counter acts the increase in atmospheric N deposition. Integrated globally the increase in N deposition from pre-industrial times led to a small increase in export production, which led to a small decrease in atmospheric pCO2. Methods: Simulations were done using the Biogeochemical Elemental Cycling (BEC) model (Moore et al., 2004) run within the NCAR CCSM3 POP Ocean model (resolution: 3.6° longitude and 0.9°-2.0° latitude) (Collins et al., 2006; Yeager et al., 2006). As nutrient concentrations vary the model can simulate the changes in phytoplankton community structure, sinking Particulate Organic Carbon (POC) export rates and air-sea CO2 exchange. In a recent study using the BEC model, changes in atmospheric dust inputs was found to impact nitrogen fixation and sinking export at various regions of the world ocean, leading to changes in global air-sea CO2 exchange (Moore et al., 2006). Another study using the BEC model quantified the key role played by dissolved iron over global oceans in driving marine nitrogen fixation and denitrification (Moore and Doney, submitted). Details about the BEC model can be found in Moore et al., (2004). Dust deposition in our simulations was from Zender et al., (2003) assuming 5% surface solubility. Atmospheric inputs of inorganic nitrogen to oceans during 1990’s were obtained from a control simulation using the UCI global Chemistry transport Model (UCICTM) (Prather et al., 1987; Jacob et al., 1997; Olsen et al., 2000; and Bian and Prather 2003; Bian and Zender 2003) embedded within an aerosol equilibrium model (Metzger et al., 2002a) which accounted for partitioning of nitrogen aerosols between ammonium and nitrate (Luo et al., submitted). For this work oceanic ammonia emissions were not included. Thus, we examine only the net land to sea N fluxes. The pre-industrial and IPCC inorganic nitrogen estimates were obtained as part of sensitivity studies. In the pre-industrial simulations anthropogenic sources were excluded and for IPCC runs CO, SOx, NOx and CH4were scaled based on IPCC A1B suggested values. Figure 1 Figure 3a Figure 3b Figure 2 Results: Model was spun up for 500 years with pre-industrial N deposition. Then three different nitrogen deposition forcings (shown in figure 1) were simulated for 48 years. Figure 2 shows the diatom, small phytoplankton and diazotroph growth limitation over the world ocean from year 48. Globally there was a decrease in N limitation for diatoms and small phytoplankton, Fe, P and light limitation increased for all phytoplankton. Figure 3a and 3b shows the differences of global distributions of N deposition, N fixation, POC export and Sea to Air CO2 exchange relative to pre-industrial conditions. POC export and oceanic uptake of atmospheric CO2 increased slightly across much of the globe excluding the Southern Ocean. The Sea to Air CO2 flux increase in Southern Ocean and subarctic North Pacific was associated with the upwelling of inorganic carbon enriched waters as a result of increased export in the nearby waters. Table 1 summarizes net oceanic N deposition, primary production, N fixation, sinking POC for year 48 and atmospheric pCO2 at the end of 48 years. Values in parenthesis in column 3 and 4 show the difference of these values from pre-industrial conditions. N deposition increased by 16 Tg in 1990’s and by 22 Tg in the IPCC simulation. Primary production and export increase while N fixation and atmospheric pCO2 decrease as the atmospheric inorganic N deposition increased. Figure 4 shows the potential contribution of atmospheric N deposition to sinking Particulate Organic Nitrogen (PON). Globally it increased over a wide area as deposition increased. The high fractions in the subtropical N. Atlantic and Arctic oceans reflect mainly very low export production in those regions. In the N-limited regions (Figure 2) atmospheric nitrogen deposition is directly increasing export by the fractions shown in Figure 4. Acknowledgements: This work was supported by funding from NSF grant OCE-0452972 to Moore and Zender and by the Climate Simulation Laboratory at National Center for Atmospheric Research. The National Center for Atmospheric Research is sponsored by the U.S. National Science Foundation. References: Bian, H., and M. J. Prather, FastJ2: Accurate simulation of stratospheric photolysis in global chemistry models, J. Atmos. Chem., 41, 281296, 2002. Bian, H., and C. S. Zender, Mineral dust and global tropospheric chemistry: Relative roles of photolysis and heterogeneous uptake, J. Geophys. Res., 108, 4672, doi:10.1029/2002JD003143, 2003. Collins W.D., M. Blackmon, C.M. Bitz, G.B . Bonan, C.S. Bretherton, J.A. Carton, P. Chang, S. Doney, J.J. Hack, J.T. Kiehl, T. Henderson, W.G. Large, D. McKenna, and B.D. Santer, 2006. The Community Climate System Model: CCSM3. J. Climate, in press. Jacob, D.J., Prather, M.J., et al., Evaluation and Intercomparison of global atmospheric transport models using 222Rn and other short lived tracers, J. Geophys. Res., 102, 59535970, 1997. Luo et al., Role of ammonia chemistry and coarse mode aerosols in global climatological inorganic aerosol distributions, 2006 submitted to Atmos. Environ. Moore et al., Nitrogen fixation amplifies the ocean biogeochemical response to decadal timescale variations in mineral dust deposition, Tellus B, International CO2 conference Special issue, 2006 Moore and Doney, Iron availability limits the ocean nitrogen inventory stabilizing feedbacks between marine denitrification and nitrogen fixation, submitted May 2006 to GBC. Moore, J.K., S.C. Doney, Lindsay Keith, 2004, Upper ocean ecosystem dynamics and iron cycling in a global three-dimensional model, Global Biogeochemical cycles, 18, GB4028, doi: 10.1029/2004GB002220. Metzger, S., F. Dentener, S. Pandis, and J. Lelieveld, Gas/aerosol partitioning: I. A computationally efficient model, J. Geophys. Res., 107, 4312,10.1029/2001JD001102, 2002a. Olsen, S.C., Hannegan, B.J., Zhu, X., and Prather, M.J., Evaluating ozone depletion from very shortlived halocarbons, Geophys. Res. Lett., 27, 14751478, 2000. Prather, M.J., MeElroy, M.B., Wofsy, S.C., Russell, G., and Rind, D., Chemistry of the global troposphere: Fluorocarbon as tracers of air motion, J. Geophys. Res., 92, 65796613,1987. Yeager, S.G., Large, W.G., Hack, J.J., Shields, C.A., 2006. The Low Resolution CCSM3, J. Climate, in press. Zender, C. S., H. Bian, and D. Newman (2003), The Mineral Dust Entrainment And Deposition (DEAD) model: Description and 1990s dust climatology, J. Geophys. Res., 108(D14), 4416, doi:10.1029/2002JD002775. Figure 4 Table 1 Discussion: Regions which were N limited prior to increased atmospheric N inputs become less N stressed after N additions, with increased export production and oceanic uptake of CO2. As the deposition increased in our simulations from pre-industrial levels, small phytoplankton and diatoms grow more efficiently relative to diazotrophs. As P and Fe get increasingly depleted at higher N deposition, the diazotrophs become more P and Fe stressed reducing N fixation. The decrease in oceanic N fixation partially compensates for the increase in atmospheric N inputs.