Download
1 / 33
330 likes | 452 Vues
This session focuses on market segments within real estate, highlighting what drives performance in various submarkets, including the impact of market conditions and property features. Presented by leading economists, it discusses the factors influencing rent growth and submarket performance, revealing that market-level trends explain a significant portion of rent variation. The analysis emphasizes the importance of local dynamics and the limitations of fixed property characteristics in guiding investment decisions. Understanding these elements is crucial for investors aiming to outperform broader market trends.

E N D
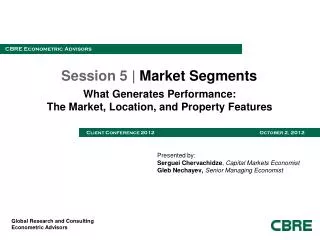
Session 5 | Market Segments What Generates Performance: The Market, Location, and Property Features Presented by: Serguei Chervachidze, Capital Markets Economist • GlebNechayev, Senior Managing Economist
Submarket Rent Growth: Can Investors Beat the Wider Market?
The Question The residual is due to changing market forces within the Submarket that are different from the MSA
Example of Regression Analysis: OFC Eq (5): Dependent Variable: Submarket Rent Growth; Fixed Effects Panel Estimation Source: CBRE Econometric Advisors
Submarket Analysis: OFC & IND Source: CBRE Econometric Advisors
Submarket Analysis: MH & Hotels Source: CBRE Econometric Advisors
Do These Differ by Bull/Bear Rent Phase? Note: Cyclical Structural Breaks are Identified using the Bai-Perron (2003) Structural Break Tests
Submarket Analysis by Bull/Bear Phase: OFC & IND OFC: Market Rent Effect Bull: 0.91 Under Bear: 0.94 Difference: Weakly Stat Sig, p = 0.11 Source: CBRE Econometric Advisors
Submarket Analysis by Bull Bear Phase: MH & Hotels Source: CBRE Econometric Advisors
Conclusions • Market rent and macro trends drive vast share of submarket performance • Submarket-unique factors that are fixed over time have very small effect on rent growth • Do property/submarket structural features matter? Not a lot! • In the down (bear) phase of the cycle, market rents have a stronger downward effect on submarket performance vs. the up (bull) phase • Remaining unexplained part of submarket performance (50% to 70%)—submarket-specific factors that are changing over time: • Local supply dynamics: building a new road; new large development • Local demand changes: Influx of high-tech firms to submarket; outflow of residents from one submarket to another • Office, Hotel, and Multifamily submarkets—highly integrated with markets • 50%-60% of submarket variation in rents explained by market variation • Industrial—little integration • Only 30% variation explained • Is warehouse different? • Homogenous property type?
How Do I Pick the “Right” Submarkets? • Step 1: Pick the right market by: • Studying the macro environment very carefully • Understanding rental fundamentals and factors that drive these fundamentals on the market level • Step 2: Within a chosen market, pick the right submarket by: • Studying and understanding factors that change on the local (submarket) level (including supply) • Do not pick a submarket solely on the basis of some fixed characteristics that do not change over time. For example: • Invest only in industrial markets only with rail-road access • Edge-of-city multifamily properties on top of hills with a good view • Office properties within 20 miles of CBD • These characteristics are responsible for a very small share of performance differences vs. the larger market over time
Property Rent Growth: How Much Does Property Characteristics and Location Matter?Cross-Section Analysis of Multi-Housing Property Performance Since 2007
Property Data Summary Source: Pierce Eislen
Cross-Section Analysis: Questions 1) How much variation in submarket rent growth can be explained by variation in: • market rent growth • submarket characteristics that don’t change (distance to downtown, submarket size, 2007 rent level relative to market) 2) How much variation in property rent growth can be explained by variation in: • market rent growth • submarket rent growth • property-specific characteristics that don’t change (age, size, number of stories, 2007 rent level relative to submarket)
Property Data Summary Source: Pierce Eislen
Market Data Summary Source: Pierce Eislen
Summary of the Results • Markets explain about 70% of variation in submarket performance and submarket characteristics that are fixed in time explain less than 5% (but all of them are statistically significant: smaller submarkets that are closer to downtown and have average higher than the market did better over 2007-2012 period) • Markets/submarkets explain about 40% of variation in rent growth across properties and property characteristics explain less than 10% (but all of them are statistically significant: smaller, older properties with lower rents relative to market, further from downtown did better over 2007-2012 period)
What About Property Investment Performance? NCREIF Building Level Data
The Question—Updated The residual is due to changing features of the individual property
Parsing Out Building-Level Returns: NCREIF OFC Source: CBRE Econometric Advisors
What’s Left To Explain? • Fixed property effects: only 20% of variation • Unlike in submarkets, these matter a lot more because investment capital pays attention to these factors • For two properties with the same rent growth, a new CBD office tower will get a lower cap rate than older suburban office park • Dynamic property effects: 53% of variation: • These are factors that are property-specific and are changing over time • Similar to dynamic submarket effects in rent studies (39% variation in office) • Property management over time is key • Signing a lease at top rates right before recession • Blend and extend • Other dynamic property effects include: • A good tenant leaving • Changes in the cost structure of the building • Changes in the immediate neighborhood of the property (a competitor tower built across the street) • These are the key elements that will help drive successful investment strategy
Fixed Effects: What Explains the 20% of OFC Investment Performance? • Stage 2 analysis: make a cross section of fixed effects from Stage 1 • We regress the fixed effects from stage one on the various property and submarket characteristics in a cross section • This shows us what drives these effects:
Stage 2: Explaining the 20%: Property/Submarket Characteristics Dependent Variable: Fixed Effects Coefficients from Stage 1; Cross-section Setup
Conclusions • Results generally in line with what we saw for rent growth analysis • The macro cycle has the strongest effect on investment performance (31% of variation): • Consistent with our research that macroeconomic/capital markets factors drive asset pricing and appreciation returns • Market rent performance still matters, but less: 13% • Time-invariant unique building effects now explain more (20%) of variation, but still not a lot • The unexplained dynamic property effects remain key (53%): • Need to manage the property with an understanding of market dynamics • Tenants, nearby competitors, and other dynamic factors matter more than property amenities • Factors that change on submarket level (e.g. demand/supply) matter more than fixed submarket characteristics • Further research is on-going: expect additional insights
So What Does It All Mean for Investing? • Study the macro/capital markets environment carefully: timing is crucial • Study market-level CRE fundamentals (rents and vacancies, demand/supply and their drivers) • Understand submarket/local/building-level dynamics: factors that are property/location/neighborhood unique and changing are the really hard part, since they are hard to measure. • Use good management to control building-level dynamics • Length of lease, CAPEX timing, etc • Do not rely solely on picking submarkets/buildings on the basis of “unique” fixed characteristics: • Edge city properties with good view, CBD high-rise properties only, etc • By picking a building at the wrong time and/or in the wrong market and/or with the wrong property/location/neighborhood dynamic will trump any investment returns advantages from getting the “right” fixed characteristics