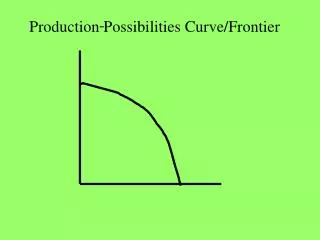
Production Possibilities Curve/Frontier
270 likes | 515 Vues
-. Production Possibilities Curve/Frontier. Crystal. Crystal. A. 1 million. B. 700,000. A. 80,000. B. 40,000. C. C. 0. 30,000. 100,000. Rum. 0. 40,000. 80,000. Rum. Ireland. Puerto Rico. Crystal Rum. Crystal Rum. A B C. 1 million 0

Production Possibilities Curve/Frontier
E N D
Presentation Transcript
- Production Possibilities Curve/Frontier
Crystal Crystal A 1 million B 700,000 A 80,000 B 40,000 C C 0 30,000 100,000 Rum 0 40,000 80,000 Rum Ireland Puerto Rico Crystal Rum Crystal Rum A B C 1 million 0 700,000 30,000 0 100,000 A B C 80,000 0 40,000 40,000 0 80,000
Crystal Crystal A 1 million B 700,000 A 80,000 B 40,000 C C 0 30,000 100,000 Rum 0 40,000 80,000 Rum Ireland Puerto Rico Which country has the absolute advantage in the production of Crystal? In the production of Rum? What did I tell you to do with absolute advantages? KICK IT OUT THE DOOR!!!
Crystal Crystal A 1 million B 700,000 A 80,000 B 40,000 C C 0 30,000 100,000 Rum 0 40,000 80,000 Rum Ireland Puerto Rico Which country has the comparative advantage in Crystal? In Rum?
Crystal Crystal A 1 million B 700,000 A 80,000 B 40,000 C C 0 30,000 100,000 Rum 0 40,000 80,000 Rum Ireland Puerto Rico There are___steps in figuring out which country has the comparative advantage. 5
Crystal Crystal A 1 million B 700,000 A 80,000 B 40,000 C C 0 30,000 100,000 Rum 0 40,000 80,000 Rum Ireland 1. Know the definition of comparative advantage One entity can produce something at a LOWER MARGINAL OPPORTUNITY COST than another entity. 2. Set up a table: Ireland Puerto Rico 1 Rum = __Crystal 1 Rum = __Crystal 1 Crystal = __ Rum 1 Crystal = __Rum 3. Go to the Xtremes (X and Y Games)
Crystal Crystal A 1 million B 700,000 A 80,000 B 40,000 C C 0 30,000 100,000 Rum 0 40,000 80,000 Rum Ireland Puerto Rico 1. Know the definition of comparative advantage Ireland Puerto Rico 1 Rum = __Crystal 1 Rum = __Crystal 1 Crystal = ____ Rum 1 Crystal = __Rum 2. Set up a table: 10 1 1/10 1 3. Go to the Xtremes (X and Y Games) 4. Fill in the blanks (starting with Puerto Rico first) 5. Circles and Arrows
Crystal Crystal A 1 million B 700,000 A 80,000 B 40,000 C C 0 30,000 100,000 Rum 0 40,000 80,000 Rum Ireland Puerto Rico We decided that Ireland should produce ALL the crystal and Puerto Rico should produce ALL the rum. How much crystal should Ireland produce? 1 million cases How much rum should Puerto Rico produce? 80,000 barrels Should Ireland just hold onto its cases of crystal and Puerto Rico just hold onto its barrels of rum? NO! What should each country do after specialization? Trade
Crystal Crystal A 1 million B 700,000 A 80,000 B 40,000 C C 0 30,000 100,000 Rum 0 40,000 80,000 Rum Ireland Puerto Rico Consumes Consumes after specialization before Trade Produces Trades and Trade (Point B) Gain from Trade IRELAND C 1 million -175,000 R 0 +35,000 825,000 700,000 +125,000 35,000 30,000 + 5,000 PUERTO RICO C 0 R 80,000 +135,000 +175,000 175,000 40,000 -35,000 45,000 40,000 +5,000
D 175,000 Crystal Crystal A 1 million B 700,000 A 80,000 B 40,000 C C 0 30,000 100,000 Rum 0 40,000 80,000 Rum Ireland D 825,000 35,000 Puerto Rico Consumes Consumes after specialization before Trade Produces Trades and Trade (Point B) Gain from Trade IRELAND Plot this column C 1 million -175,000 R 0 +35,000 825,000 700,000 +125,000 35,000 30,000 + 5,000 PUERTO RICO C 0 R 80,000 +135,000 +175,000 175,000 40,000 -35,000 45,000 40,000 +5,000
175,000 D Crystal Crystal A 1 million B 700,000 A 80,000 B 40,000 C C 0 30,000 100,000 Rum 0 40,000 80,000 Rum Ireland D 825,000 35,000 45,000 Puerto Rico Which country is obviously better off through this specialization and trade--Ireland or Puerto Rico? Both Countries are!!! Both countries are now outside their own production capabilities. Through specialization and trade all parties are better off.
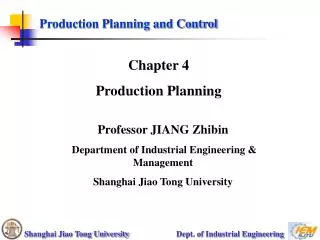
Cars M Production Possibilities Curve for Atlantis 30 P 20 Production Possibilities Curve for Xanadu Q N Tractors 10 40
Cars M Production Possibilities Curve for Atlantis 30 P 20 Production Possibilities Curve for Xanadu Q N Tractors 10 40 Assume that two countries, Atlantis and Xanadu, have equal amounts of resources. Atlantis can produce 30 cars or 10 tractors or any combination, as shown by the line MN in the figure above. Xanadu can produce 20 cars or 40 tractors or any combination, as shown by the line PQ in the figure above.
Cars M Production Possibilities Curve for Atlantis 30 P 20 Production Possibilities Curve for Xanadu Q N Tractors 10 40 (a) Which country has an absolute advantage in the production of tractors? Explain how you determined your answer.
Cars M Production Possibilities Curve for Atlantis 30 P 20 Production Possibilities Curve for Xanadu Q N Tractors 10 40 (b) Which country has a comparative advantage in the production of cars? Using the concept of opportunity costs, explain how you determine your answer.
Cars M Production Possibilities Curve for Atlantis 30 P 20 Production Possibilities Curve for Xanadu Q N Tractors 10 40 (c) If the two countries specialize and trade with each other, which country will import cars? Explain why.
Cars M Production Possibilities Curve for Atlantis 30 P 20 Production Possibilities Curve for Xanadu Q N Tractors 10 40 (d) If the terms of trade are such that one car can be exchanged for one tractor, explain how Atlantis will benefit from such trade.
Cars M Production Possibilities Curve for Atlantis 30 P 20 Production Possibilities Curve for Xanadu Q N Tractors 10 40 Assume that two countries, Atlantis and Xanadu, have equal amounts of resources. Atlantis can produce 30 cars or 10 tractors or any combination, as shown by the line MN in the figure above. Xanadu can produce 20 cars or 40 tractors or any combination, as shown by the line PQ in the figure above.
Cars M Production Possibilities Curve for Atlantis 30 P 20 Production Possibilities Curve for Xanadu Q N Tractors 10 40 (a) Which country has an absolute advantage in the production of tractors? Explain how you determined your answer. Xanadu has the absolute advantage in tractors. It can produce more tractors than Atlantis.
Atlantis 1car = __ trac. 1 trac = __ cars Cars 1/3 M Production Possibilities Curve for Atlantis 30 3 P Xanadu 1 car = __ trac. 1 trac = __ cars 20 Production Possibilities Curve for Xanadu 2 1/2 Q N Tractors 10 40 (b) Which country has a comparative advantage in the production of cars? Using the concept of opportunity costs, explain how you determine your answer. Atlantis has the comparative advantage in cars. It’s marginal opportunity cost of producing a car is less than Xanadu’s (1/3 trac. compared to ½).
Atlantis 1car = __ trac. 1 trac = __ cars Cars 1/3 M Production Possibilities Curve for Atlantis 30 3 P Xanadu 1 car = __ trac. 1 trac = __ cars 20 Production Possibilities Curve for Xanadu 2 1/2 Q N Tractors 10 40 (c) If the two countries specialize and trade with each other, which country will import cars? Explain why. Xanadu should import cars. The opportunity cost of producing a car in Xanadu is too high. It would have to give up the production of 2 tractors.
Atlantis 1car = __ trac. 1 trac = __ cars Cars 1/3 M Production Possibilities Curve for Atlantis 30 3 P Xanadu 1 car = __ trac. 1 trac = __ cars 20 Production Possibilities Curve for Xanadu 2 1/2 Q N Tractors 10 40 (d) If the terms of trade are such that one car can be exchanged for one tractor, explain how Atlantis will benefit from such trade. If Atlantis were to produce its own tractors, it would have to give up the production of 3 cars. By trading 1 tractor for 1 car, this is a good terms of trade because Atlantis gets to a point outside its own PP curve.
Mars Venus Food Clothing Food Clothing 0 30 2 24 4 18 5 12* 8 6 10 0 0 40 4 32 8 24* 12 16 16 8 20 0
Mars Venus Food Clothing Food Clothing 0 30 2 24 4 18 5 12* 8 6 10 0 0 40 4 32 8 24* 12 16 16 8 20 0 Constant or Increasing?
Mars Venus Food Clothing Food Clothing 0 30 2 24 4 18 5 12* 8 6 10 0 0 40 4 32 8 24* 12 16 16 8 20 0 Absolute Advantage?
Mars Venus Food Clothing Food Clothing 0 30 2 24 4 18 5 12* 8 6 10 0 0 40 4 32 8 24* 12 16 16 8 20 0 Comparative Advantage?