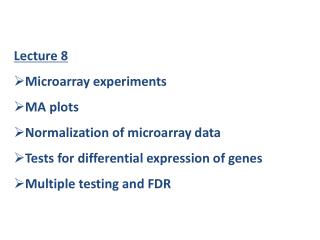
Lecture 4 Microarray & Analysis
Lecture 4 Microarray & Analysis. Alizadeh et al. Nature 403 (2000) 503-511. Microarray revolutionized biology and medicine research. One gene at a time before, now tens of thousands simultaneously - PROTEOMICS Gene expression Gene disease relation Gene-gene interaction


Lecture 4 Microarray & Analysis
E N D
Presentation Transcript
Lecture 4Microarray & Analysis Alizadeh et al. Nature 403 (2000) 503-511
Microarray revolutionized biology and medicine research • One gene at a time before, now tens of thousands simultaneously - PROTEOMICS • Gene expression • Gene disease relation • Gene-gene interaction • Finding Co-Regulated Genes • Understanding Gene Regulatory Networks • Many, many more
Basic idea of Microarray • 製造原理 • 將可特徵基因之對偶鹼基序列 – 稱為探針(probe) – 排列放置在微晶片(microchip) 上 • 應用原理 • 將含基因序列之樣品 (sample) 液體到在微晶片上 • 利用互補鹼基雜交作用(hybridization) 的原理,由樣品 與微晶片上基因序列相互作用的情形摘取所需的資訊
Basic idea of Microarray • Construction • Place array of probes on microchip • Probe (for example) is oligonucleotide ~25 bases long that characterizes gene or genome • Each probe has many, many clones • Chip is about 2cm by 2cm • Application principle • Put (liquid) samplecontaining genes on microarray and allow probe and gene sequences to hybridize and wash away the rest • Analyze hybridization pattern
cDNA microarray schema cDNA晶片製造原理
Microarray analysis Operation Principle: Samples are tagged with flourescent material to show pattern of sample-probe interaction (hybridization) Microarray may have 60K probe
Microarray Processing sequence From: Shin-Mu Tseng tsengsm@mail.ncku.edu.tw
Gene Expression Data mRNA samples Gene expression data on p genes for n samples sample1 sample2 sample3 sample4 sample5 … 1 0.46 0.30 0.80 1.51 0.90 ... 2 -0.10 0.49 0.24 0.06 0.46 ... 3 0.15 0.74 0.04 0.10 0.20 ... 4 -0.45 -1.03 -0.79 -0.56 -0.32 ... 5 -0.06 1.06 1.35 1.09 -1.09 ... Genes Gene expression level of gene i in mRNA sample j Log (Red intensity / Green intensity) = Log(Avg. PM - Avg. MM)
Some possible applications • Sample from specific organ to show which genes are expressed • Compare samples from healthy and sick host to find gene-disease connection • Probes are sets of human pathogens for disease detection
Amount of data from single microarray is huge • If just two color, then amount of data on array with N probes is 2N • Cannot analyze pixel by pixel • Analyze by pattern – cluster analysis
Major Data Mining Techniques • Link Analysis • Associations Discovery • Sequential Pattern Discovery • Similar Time Series Discovery • Predictive Modeling • Classification • Clustering
Cluster Analysis: grouping similarly expressed genes, Cell samples, or both • Strengthens signal when averages are taken within clusters of genes (Eisen) • Useful (essential ?) when seeking new subclasses of cells, tumours, etc. • Leads to readily interpreted figures
Some clustering methods and software • Partitioning:K-Means, K-Medoids, PAM, CLARA … • Hierarchical:Cluster, HAC、BIRCH、CURE、ROCK • Density-based: CAST, DBSCAN、OPTICS、CLIQUE… • Grid-based:STING、CLIQUE、WaveCluster… • Model-based:SOM (self-organized map)、COBWEB、CLASSIT、AutoClass… • Two-way Clustering • Block clustering
A review paper assessing various methods • Algorithmic Approaches to Clustering Gene Expression Data, Ron Shamir School of Computer Science, Tel-Aviv University Tel-Aviv • http://citeseer.nj.nec.com/shamir01algorithmic.html • Conclusion: hierarchical clustering exceptional
Hierarchical (used most often) agglomerativity divisivity
Hierarchical Clustering: grouping similarly expressed genes Gene Expression Profile Analysis Sample … … …. B C A gene 0.4 0.9 0 0.5 .. .. 0.8 0.2 0.8 0.3 0.2 .. .. 0.7 0.6 0.2 0 0.7 .. .. 0.3 … … … … … … … 1 2 3 4 .. .. 1000 From: Shin-Mu Tseng tsengsm@mail.ncku.edu.tw
After Clustering Gene Expression Profile Analysis sample … … …. B C A gene .. 0 0.4 0.5 .. 0.9 0.8 .. 0.3 0.2 0.2 .. 0.8 0.7 .. 0 0.6 0.7 .. 0.2 0.3 … … … … … … … .. 3 1 4 .. 2 1000 From: Shin-Mu Tseng tsengsm@mail.ncku.edu.tw
randomized row column both data clustered Eisen et al. Proc. Natl. Acad. Sci. USA 95 (1998) time
Types of Similarity Measurements • distance measurements • correlation coefficients • association coefficients • probabilistic similarity coefficients
Correlation Coefficients • The most popular correlation coefficient is Pearson correlationcoefficient (1892) • correlation between X={X1, X2, …, Xn} and Y={Y1, Y2, …, Yn}: • where sXYis the similarity between X & Y sXY From: Shin-Mu Tseng tsengsm@mail.ncku.edu.tw
Now can use similarity forTree construction sXX • Normalize similarity so that =1 • Then have nxn similarity matrixS whose diagonal elements are 1 • Define distance matrix by (for example) D = 1 – S Diagonal elements of D are 0 • Now use distance matrixto built tree (using some tree-building software recall lecture on Phylogeny)
A dendrogram (tree) for clustered genes E.g. p=5 Let p = number of genes. 1. Calculate within class correlation. 2. Perform hierarchical clustering which will produce (2p-1) clusters of genes. 3. Average within clusters of genes. 4 Perform testing on averages of clusters of genes as if they were single genes. Cluster 6=(1,2) Cluster 7=(1,2,3) Cluster 8=(4,5) Cluster 9= (1,2,3,4,5) 1 2 3 4 5
A real case Nature Feb, 2000 Paper by Allzadeh. A et al Distinct types of diffuse large B-cell lymphoma identified by gene expression profiling
Validation Techniques:Hubert’s Γ Statistics • X=[X(i, j)] andY=[Y(i, j)] are two n×n matrix • X(i, j): similarity of gene i and gene j • Hubert’s Γ statistic represents the point serial correlation: • where M = n (n - 1) / 2 • A higher value of Γ represents the better clustering quality. if genes i and j are in same cluster, otherwise From: Shin-Mu Tseng tsengsm@mail.ncku.edu.tw
Gene Expression is time-dependent Time Course Data
Sample of time course of clustered genes time time time
Limitations • Cluster analyses: • Usually outside the normal framework of statistical inference • Less appropriate when only a few genes are likely to change • Needs lots of experiments • Single gene tests: • May be too noisy in general to show much • May not reveal coordinated effects of positively correlated genes. • Hard to relate to pathways
Some useful links • Affymetrixwww.affymetrix.com • Michael Eisen Lab at LBL (hierarchical clustering software “Cluster” and “Tree View” (Windows)) • rana.lbl.gov/ • Stanford MicroArray Database (“Xcluster” (Linux)) • genome-www4.stanford.edu/MicroArray/SMD/ • Review of Currently Available Microarray Software • www.the-scientist.com/yr2001/apr/profile1_010430.html • Microarray DB • www.biologie.ens.fr/en/genetiqu/puces/bddeng.html
Some papers Eisen, M. B. et al., (1998)."Cluster analysis 'and display of genome-wide expression patterns."Proc Natl Acad Sci U S A 95(25): 14863-8.Wen, X., et al., (1998). "Large-scale temporal gene ex- pression mapping of central nervous system development."Proc Natl Acad Sci U S A 95(1): 334-9.U. Alon, et al., (1999) “Broad patterns of gene expression revealed by clustering analysis of tumor and normal colon tissues probed by oligonucleotide arrays.”PNAS, 96:6745-6750, June 1999.Spellman, P. T. et al., (1998)."Comprehensive identification of cell cycle-regulated genes of the yeastSaccharomyces cerevisiae by microarray hybridization.”Mol Biol Cell 9(12): 3273-97