Download

1 / 13
180 likes | 730 Vues
General Features of Enzymes. Most biological reactions are catalyzed by enzymes Most enzymes are proteins Highly specific (in reaction & reactants ) Involvement of cofactor or coenzyme in some enzymes (prosthetic groups, holoenzyme, apoenzyme) Activity regulated through

E N D
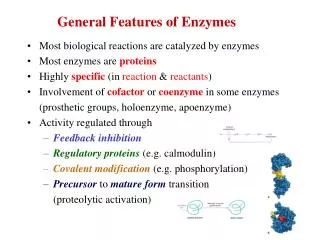
General Features of Enzymes • Most biological reactions are catalyzed by enzymes • Most enzymes are proteins • Highly specific (in reaction & reactants) • Involvement of cofactor or coenzyme in some enzymes (prosthetic groups, holoenzyme, apoenzyme) • Activity regulated through • Feedback inhibition • Regulatory proteins (e.g. calmodulin) • Covalent modification (e.g. phosphorylation) • Precursor to mature form transition (proteolytic activation)
How Enzymes Work • Substrate binding is the first step of enzymatic catalysis • Substrate • Active site • Binds substrate (by multiple weak interactions) • A 3-dimensional entity complementary to substrate • Contains catalytic residues • Size and location: Small; located at clefts or crevices • Source of binding specificity
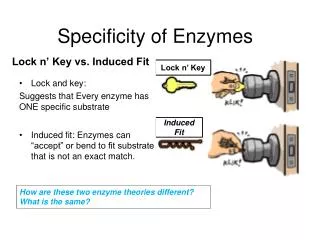
Enzyme-substrate interaction: • Lock-and-keymodel • Induced fit model
Enzymes Accelerate Reaction Rate How? • Enzymes accelerate reaction ratebutdo not alter equilibrium! • Rate of reaction= (Ae-G‡/RT)[S] • Accelerate reaction rate by stabilizing transition states (G‡) • Essence of catalysis: specific binding of the transition state
k1 k2 Michaelis-Menten ModelAccounts for Kinetic Properties of many Enzyme k3 • Kinetic properties of many enzymes (V vs. [S] plot) • Michaelis-Menten Model E + S ES E + P • Purpose: using the model to derive an expression relating rate of reaction to [E] and [S] and k1, k2, and k3 • Assumption #1: no product reverts to initial substrate (initial state) • Assumption #2: steady state ([ES] is constant) • k1[E][S]=k2[ES]+k3[ES], so [ES] = [E][S]/KM ; KM =(k2+k3)/k1 • [E] = [ET] - [ES]; [S] = [ST] - [ES] - [P] • work under the following condition: [ET] << [ST] ; and at initial time, so [P] is negligible, and so [S] = [ST] [ES] = [ET] [S]/(KM + [S]) so, V = k3 [ES] = k3[ET] [S]/(KM + [S]) = Vmax [S]/(KM + [S])
Michaelie-Menten equations explains the kinetic trend seen for many enzymes V = Vmax [S]/(KM + [S]): • When [S] << KM, V = Vmax [S]/KM , V is directly proportional to [S] • When [S] >> KM , V = Vmax , rate is maximal, independent of [S] • When [S] = KM, V = (1/2) Vmax, so, KM = [S] when V is 1/2 Vmax
Determine KM and Vmax • Experimental Procedure • Set up several reactions with fixed [ET] but increasing [ST] • Experimentally determine V at various [ST] (simplified as [S]; V is initial velocity so [P] is negligible) • Data Analysis • Using Michaelis-Menten Equation: V = Vmax [S]/(KM + [S]) • Plot V vs. [S]; computer curve fitting to find KM and Vmax • Lineweaver-Burk Plot 1/V = 1/Vmax + (KM/Vmax) 1/[S] • Plot 1/V vs. 1/[S] • Y intercept = 1/Vmax; X intercept = -1/KM
Kinetic Perfection in Enzymatic Catalysis • For Enzymes that Obey Michaelis-Menten Model • When all enzyme molecules are saturated with substrate • V = Vmax = k3 [ET], rate constant is k3 (= kcat) • When [S] << KM and so most of the active sites are unoccupied • V = k3 [ES]= k3 [E][S]/KM as [S] << KM, so [E] [ET], so V = k3 [ET][S]/KM = (k3/KM)[ET][S] so V depends on k3 / KM: k3 / KM= k3 k1 / (k2 + k3) < k1 k1 cannot be faster than diffusion controlled encounter of an enzyme and its substrate, which is108 to 109 M-1 s-1 So, the upper limit of k3 / KM is 108 to 109 M-1 s-1. • For Enzymes that Do not Obey Michaelis-Menten Model • When all E are saturated with S, rate depends on k cat; kcat k3 • When not all E are saturated with S, rate depends on k cat / KM • Some enzymes having k3/KM of 108 - 109 M-1 s-1 reached kinetic perfection! Their catalytic velocity is limited by the rate at which they encounter substrate in the solution.
Enzyme Inhibition • Irreversible Inhibition • Inhibitor destroys a functional group on the enzyme • Or inhibitor binds to the enzyme very tightly (covalently or noncovalently) dissociates very slowly from enzyme • Reversible Inhibition
Reversible Inhibition • Inhibitor binds and dissociate rapidly from the enzyme • Competitive inhibitor • Inhibitor binds at active site; compete for binding with substrate; exist as either ES or EI; no ESI • Inhibitor structure resembles that of substrate • Overcome competitive inhibition by increasing [S] • Noncompetitive inhibitor • Inhibitor binds at a site other than active site • Binding of noncompetitive inhibitor decreases turnover number (reduces k3)
Kinetics of Enzyme Inhibition • Assume the enzyme exhibits Michaelis-Menten Kinetics • Set up enzymatic reactions with fixed [ET] but increasing [ST] • One set without inhibitor and another set with inhibitor • Plot 1/V vs. 1/[S] (Lineweaver-Burk Plot)
Kinetics of Enzyme Inhibition • Competitive Inhibition • The two lines on the plot have the same Y intercept (Same V max) • KM and KIM are different : KIM = KM (1 + [I]/KI) KI = [E][I]/[EI] (for E + I EI) • 1/V = 1/Vmax + KM/Vmax (1 + [I]/KI) (1/[S]) • KM and KIM can be determined from the Lineweaver-Burk plot • KM’ = KM (1 + [I]/KI) allows the determination of KI • Inhibition can be overcome by increasing [S]
Kinetics of Enzyme Inhibition • Noncompetitive Inhibition • Same KM in the presence and absence of Inhibitor • Smaller V max in the presence of Inhibitor • VI max = V max /(1 + [I]/KI) • VI max and V max can be determined from the Lineweaver-Burk plot • VI max = V max /(1 + [I]/KI) allows the determination of KI • Cannot be overcome by increasing [S]