3.1 Graph using Intercepts
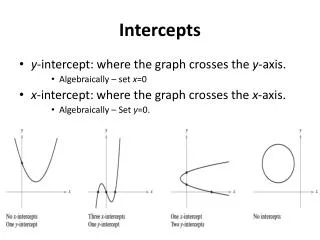
3.1 Graph using Intercepts. Objective: Graph a linear equation using intercepts and by making a table. Intercept. x- intercept - where the line crosses the x-axis y-intercept - where the line crosses the y-axis. Page 154 example 2.

3.1 Graph using Intercepts
E N D
Presentation Transcript
3.1 Graph using Intercepts Objective: Graph a linear equation using intercepts and by making a table
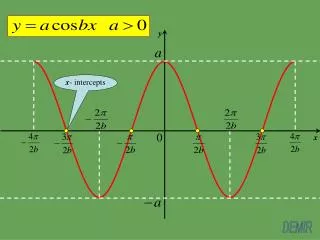
Intercept x- intercept - where the line crosses the x-axis y-intercept - where the line crosses the y-axis
A swimming pool is being drained at a rate of 720 gallons per hour. The table shows the function relating the volume of water in a pool and the time in hours that the pool has been draining. Page 155 Example 3
Finding the x- intercept 1) Substitute 0 for y 2) Then solve for x 3) (x, 0)
Finding the y-intercept 1) Substitute 0 for x 2) Then solve for y 3) (0, y)
p. 159 #50 • An amusement parks charges $50 for admission before 6pm and $20 for admission after 6pm. On Saturday, the park took in a total of $20,000. • Write an equation that represents the number of admissions that may have been sold. Let x represent the number of admissions sold before 6pm, and let y represent the number of admission sold after 6pm. • Graph the equation • Find the x- and y-intercepts of the graph. What does each intercept represent
Journal Can a line only have one intercept or must it always have an x-intercept and a y-intercept?
Homework Page 157-158 #’s 19-34 odd