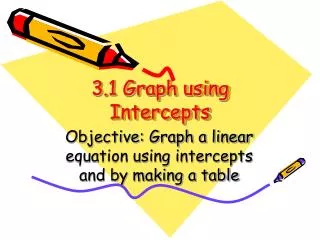
Graphing using intercepts
Learn how to graph and solve equations by understanding coordinate axes and relationships, with a focus on finding intercepts. Explore practical examples like planning events, determining stock quantities, and mastering the graphing process step-by-step.

Graphing using intercepts
E N D
Presentation Transcript
Graphing using intercepts Section 4.3
The Concept • Today we’re going to talk about a different method of graphing and solving equations • We’ll use our understanding of the coordinate axes coupled with our ability to solve equations
Coordinate Relationships As we’ve already seen through our other graphing explorations, there is an inherent relationship between coordinate pairs. Bellwork Example: • There is a relationship between the number of bands and number of sweaters bought • As one increases, the other decreases according to the rules of their relationship i.e. the equation
Coordinate Relationships This relationship is seen most dramatically when one quantity is 0 Bellwork Example: • If we don’t buy any sweaters, how many bands can we buy? • 780 • If we don’t buy any bands, how many sweaters can we buy? • 78
Y X Coordinate Relationships Let’s graph (780, 0) and (0, 78) Can we now make a line between these two points to show the relationship between them?
Let’s look at this relationship in table format To Excel File
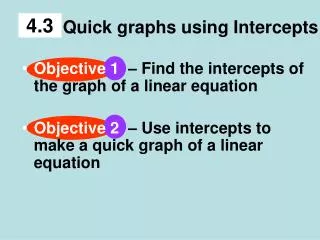
Steps for Lines using intercepts • Draw axes • Use a Straightedge • Label X, Y • Include arrowheads • Determine a Scale • Label several points • Find and Plot the intercepts • Write coordinate pair next to point • Draw line • Use a Straightedge • Connect the two points • Draw Arrowheads
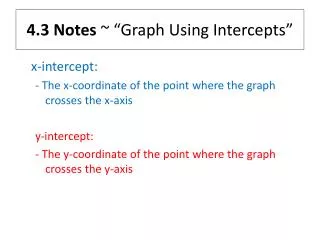
How do we find the intercepts? First remember what our X & Y Intercepts are
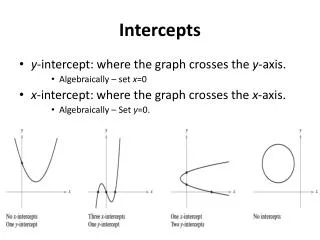
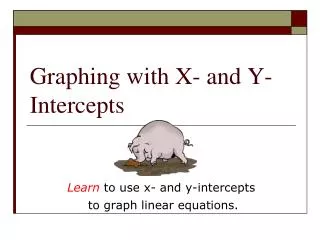
Y X X & Y Intercepts We can get a lot of information from a graph • A useful piece of information is the x-intercept and the y-intercept • X-intercept is where the line crosses the x-axis or where y=0 • Y-intercept is where the line crosses the y-axis or where x=0 y intercept x intercept
Y X How do we find the intercepts? First remember what our X & Y Intercepts are Second we simply solve our equation twice • Once for x with y=0 • Again for y with x=0
Example • What is the x-intercept of the following equation • 2y+3x=6
Example • What is the y-intercept of the following equation • 5y-4x=20
Example • What is the x-intercept of the following equation • 7y-3x=22
Y X Practice
Y X Practice
Practical Example • You are helping to plan an awards banquet for your school, and you need to rent tables to seat 180 people. Tables come in two sizes. Small tables seat 4 people, and large tables seat 6 people. • Write an equations showing the relationship between small tables and large tables • Find the intercepts of the graphs • Graph the equation • Give four possibilities for the number of each size table you could rent
Last problem • Student Council has decided to start selling UA “baller bands” and dress code regulation sweaters to the students. Wrist bands cost $2 each and sweaters are $20 each. You are a “consultant” to Student Council in charge of figuring out how many they should order for stock. They can spend a total of $1560. First figure an equation to show the relationship between quantity of bands (x) to sweaters (y) and then solve it when y=41.
Y X Most Important Points • Our x & y intercepts can help us graph easily • x-intercept occurs where y=0 • y-intercept occurs where x=0
Homework 4.3 1-10, 16-21, 28-33, 37, 44-47, 51-56