Download
1 / 30
300 likes | 431 Vues
A Description of the Commercial Fishery on Lake Superior in 2000. Mark P. Ebener Chippewa/Ottawa Resource Authority. 30. Suckers. Burbot. Salmon. 25. 20. Millions of Pounds. 15. 10. 5. 0. 1867. 1877. 1887. 1897. 1907. 1917. 1927. 1937. 1947. 1957. 1967. 1977. 1987. 1997.

E N D
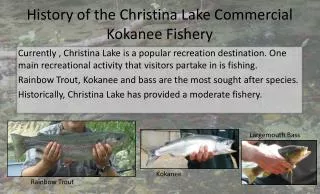
A Description of the Commercial Fishery on Lake Superior in 2000 Mark P. Ebener Chippewa/Ottawa Resource Authority
30 Suckers Burbot Salmon 25 20 Millions of Pounds 15 10 5 0 1867 1877 1887 1897 1907 1917 1927 1937 1947 1957 1967 1977 1987 1997 Commercial Fishery Harvest Lake Superior, 1867 to 2000 Walleye Yellow perch Smelt Menominee Chubs Herring Whitefish Siscowet Lake trout
$1.00 $1.00 $0.80 $0.80 $0.60 $0.60 $0.40 $0.40 $0.20 $0.20 $0.00 $0.00 1981 1983 1985 1987 1989 1991 1993 1995 1997 1999 1981 1983 1985 1987 1989 1991 1993 1995 1997 1999 $1.00 $1.00 $0.80 $0.80 $0.60 $0.60 $0.40 $0.40 $0.20 $0.20 $0.00 $0.00 1981 1983 1985 1987 1989 1991 1993 1995 1997 1999 1981 1983 1985 1987 1989 1991 1993 1995 1997 1999 Price Per Pound, 1981-1999 Lake trout Whitefish Chubs Siscowet $1.00 $1.00 Smelt Herring $0.80 $0.80 $0.60 $0.60 $0.40 $0.40 $0.20 $0.20 $0.00 $0.00 1981 1983 1985 1987 1989 1991 1993 1995 1997 1999 1981 1983 1985 1987 1989 1991 1993 1995 1997 1999
Commercial Fishery Number of Licenses 1965 U. S. Waters = 542 >all state or provincial 1999 U. S. and Canadian Waters = 350 >mostly Native American
Changing Nature of Fishery • 1960s Change in Philosophy by States • Commercial -------> Recreational • 1970s Re-affirmation of Treaty Rights • - re-allocate fisheries to tribes • 1980s Modernization of Ontario Fishery • - reduce # licenses & create ITQs
Commercial Fishery Regulations • ITQs in Ontario • Harvest Limits (TACs) • Limit on number or length of nets • Minimum mesh size restrictions • Closed seasons, closed areas • Limited Entry • Species limitations • Limits on size and number of vessels
CORA Whitefish Fishery - 1981-1999 Trap net Small Large Ice Statistic boat boat fishery 178 232 539 96 No. fish Effort 7,600 15,800 4 3,200 CPUE 26 18 140 32 39 94 54 70 Depth (ft) Nights 2 2 4 3
Commercial Fishery Harvest 1970-2000 All others Smelt Chubs Herring Whitefish Lake Trout
Location Principle Whitefish Fisheries Thunder Bay North Entry Eastern Ontario Keweenaw Bay Apostle Islands Whitefish Bay Munising
Effort Targeted at Whitefish, 1973-2000 Trap Net Gill Net
Whitefish Catch Rate, 1973-2000 160 160 Trap net 120 120 Trap Net CPUE Gill Net CPUE 80 80 Gill net 40 40 0 0 1973 1978 1983 1988 1993 1998
Change Gill Net Height - CORA Percent of Effort 100% 36 75 50 50 50 80% 60% 40% 36 36 28 20% 28 0% 1973-1977 1978-1983 1984-1990 1991-1998 Years
Changes in Gill Net Twine Diameter Proportion of Gill Net Effort 100% 23 23 20 20 80% 28 60% 40% 23 20% 28 23 0% 1973-1977 1978-1983 1984-1990 1991-1998 Years
Location of Principle Lake Herring Fisheries Black Bay Thunder Bay Minnesota Apostle Islands Keweenaw Bay Whitefish Bay
Lake Superior Chubs Shortjaw Bloater Kiyi
Catch Rate Herring & Chubs, 1973-2000 700 600 Herring 500 400 CPUE (kg/km) 300 Chubs 200 100 0 1973 1978 1983 1988 1993 1998
Wisconsin Comml Herring Fishery Gill Net Mesh Sizes, 1974-2000 100% 80% 60% Percent of Effort 3 inch 40% 2 inch 20% 0% 1974 1977 1980 1983 1986 1989 1992 1995 1998 Year
Lake Trout Catch Rate Large Mesh Gill Net Fishery 70 75-150 ft 60 50 40 >150 ft CPUE 30 20 <75 ft 10 0 Jan Feb Mar Apr May Jun Jul Aug Sep Oct Nov Dec Month
Large Mesh Gill Net Catch Rate,Lake Trout Forms, 1950-1998 350 300 250 200 Kilograms per Kilometer Siscowet 150 100 hatchery Lean wild 50 wild 0 1950 1960 1970 1980 1990
Summary 1) Size of fishery declining 2) Primarily Native American fishery 3) Prices declining or stable 4) Whitefish primary fishery, herring secondary 5) Gill net effort declining 6) Trap net effort increasing 7) Lake trout harvest declining