Download
1 / 75
750 likes | 1.03k Vues
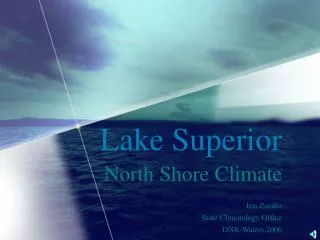
Lake Superior. North Shore Climate. Jim Zandlo State Climatology Office DNR-Waters 2006. Superior Climate. 2005-06 snow season Dry summer, low lake. Superior Climate. 2005-06 snow season More-or-less ‘normal’ precipitation spring runoff was (probably) more-or-less ‘normal’

E N D
Lake Superior North Shore Climate Jim Zandlo State Climatology Office DNR-Waters 2006
Superior Climate • 2005-06 snow season • Dry summer, low lake
Superior Climate • 2005-06 snow season • More-or-less ‘normal’ precipitation • spring runoff was (probably) more-or-less ‘normal’ • Snowfall pattern very similar to 4-year SnowRules! result • climate.umn.edu/SnowRules then click on 2005-06 map
Superior Climate • 2005-06 snow season • Snowfall transect updated • Fraction of median (was fraction of max) • Log-of-distance spreads out values close to Lake Superior • climate.umn.edu/SnowRules then click on 2005-06 map
Superior Climate • 2005-06 snow season • Dry summer • Low Lake Superior • Basic hydrology • GLERL time series
Superior Climate • 2005-06 snow season • Dry summer • Near record low water levels (1925-26) on Lake Superior • Basic hydrology • Summer is primary recharge period for Lake Superior • GLERL time series • What happens next?
Lake Level: A range of almost 4 feet in the observational record.
Basic Lake Hydrology Lake level = old lake level + precipitation on lake + runoff from surrounding land (flow in) -lake evaporation - flow out at outlet (Sault Saint Marie, MI) +/-groundwater flow
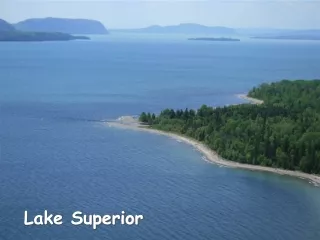
Geography and General Hydrology • large, ‘state-sized’ watershed • ‘narrow’ along American shore
Water coming in … Runoff 37% Diversion 4% Deposition 0.2% Evaporation 43% Precipitation 59% on lake St. Mary’s River 57% …must go out (most of the time)
Water coming in … Runoff 1.8 ft Runoff 1.7 ft Precipitation 3.1 ft Diversion 0.2 ft Deposition 0.2% Precipitation 2.7 ft Year ending 11/1985 had 10% more water …varies Runoff 1.1 ft Precipitation 2.6 ft Year ending Feb 2001 had 15% less water
Water coming in … Runoff 1.8 ft Runoff 1.7 ft Precipitation 3.1 ft Diversion 0.2 ft Deposition 0.2% Precipitation 2.7 ft Year ending 11/1985 had 10% more water …varies Runoff 1.1 ft Precipitation 2.6 ft Year ending Feb 2001 had 15% less water
Water coming in … Runoff 1.8 ft Runoff 1.7 ft Precipitation 3.1 ft Diversion 0.2 ft Deposition 0.2% Precipitation 2.7 ft Year ending 11/1985 had 10% more water …varies Runoff 1.1 ft Precipitation 2.6 ft Year ending Feb 2001 had 15% less water
Superior Climate Future developments?(What happens next?)
Lake Superior evaporation … is not the same as evapotranspiration from nearby land surfaces
NOAA Buoys • meteorological parameters • sea measurement • wave info • water temperature • -
Lake Evaporation equation • Evaporation = factor * D • ‘factor’ varies with weather, surface conditions, etc. • ‘D’ is the difference in vapor pressure between two different air masses • If this year’s atmospheric humidity was essentially ‘normal’ (don’t know yet) then using the above equation, evap would have been about 0.5 foot more than ‘normal’ this Aug-Oct.
Lake Evaporation equation • September water at 9+°F ’above normal’has cooled to a little more than 5+°F by Oct 23. The water will tend toward 32°F (and be ‘more normal’) as winter progresses. • If water temperature becomes ‘normal’ by mid-winter, an additional 0.2 feet or more than ‘normal’can be expected to evaporate from the lake this winter.
Where will it actually end up? Lake Level: A range of almost 4 feet in the observational record.
Winter 2006-07 Outlook (a strong ‘el nino’ influence)
Let it snow! Varley
Lake Superior North Shore Climate (thermochrons) Jim Zandlo State Climatology Office DNR-Waters 2006
Thermochrons, transects Thermochrons, the dime sized devices that measure and store thousands of temperatures, are being used throughout the SnowRules! study area to gather temperatures where the snow falls, namely on snowboards. They are also being used to get air and water temperatures at a few other locations. See the data at climate.umn.edu/SnowRules
f ° F at 5/28/2006 12:00
Superior Climate • 2005-06 snow season • Dry summer • Near record low water levels (1925-26) on Lake Superior • Basic hydrology • Summer is primary recharge period for Lake Superior • GLERL time series • What happens next?
Lake Level: A range of almost 4 feet in the observational record.
Superior Climate • Geography and Hydrology • Summarizing the observations • Normal Temperature • Satellite-based measurements • Is it ‘elevation’ or ‘the lake’ • Normal Precipitation • Snowfall patterns • Temperature versus snow