Download
1 / 28
280 likes | 396 Vues
CITY OF CAPE TOWN WATER QUALITY STATUS REPORT. 2006-06-21. MPHARU HLOYI (Manager: Scientific Services). LEGISLATION. National Water Act requires the Minister of Water Affairs to be:

E N D
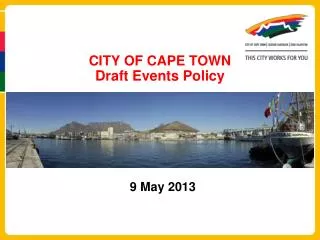
CITY OF CAPE TOWN WATER QUALITYSTATUS REPORT 2006-06-21 MPHARU HLOYI (Manager: Scientific Services)
LEGISLATION • National Water Act requires the Minister of Water Affairs to be: responsible to ensure that our water is safe for drinking, for recreation and a range of diverse life and sustainable economic activities
OBJECTIVES • City of Cape Town Quality Status through the entire water value chain • Addressing Challenges on Water Quality from Abstraction to Discharge • The present City’s capabilities on managing water quality
WAETR QUALITY PROCESS • Dams • Water Treatment • Reticulation • WWTW • Aquatic systems • Coastal
Current Status • The entire Water Quality value chain of the city is measured at Scientific Services of Water Services Department situated in Athlone. BULKWATER • 11 Water Treatment Works with monitoring programme of samples= 64 844 per year • Frequency of sampling=weekly on composite raw and final water • Frequency of sampling on operation=hourly • 96%compliance with SANS 241:2005.
Water Quality Monitoring Drinking Water Quality Monitoring
BULK WATER CHALLENGES • Water quality from abstraction has deteriorated and impacts on cost of treatment of potable water. (ref: Towards s strategy for a waste discharge system : DWAF 2003) not applied effectively. • Algae proliferation from the Dams impacts treatment, taste, odour and toxins e.g (Theewaterskloof and Voelvlei Dams) • Powdered activated Carbon is added to remove the taste,odour and toxins and very expensive. • Uniformity on intepretation of SANS 241:2005 for Compliance
ALGAL MONITORING & IDENTIFICATION PROCESS • Algae • Sample collection • Microscopic Algal identification of toxins • Microcystins identification by Elisa Technology • Advice WTW to use Powder Activated Carbon or not put high cost
RETICULATION Drinking water supply • Total of 256 Reservoirs and Distribution points in formal and settlements. • Frequency of sampling is on weekly basis • Total 98 976 physical, microbiological and chemical analysis measured per year • 98%compliance with SANS 241:2005. • Water supply is still safest and cleanest to drink from your tap.
Wastewater(Domestic &Industrial Effluent) • Total 4725 registered(commercial &Industrial) • 350 industrial effluent tariff samples based on City By-Law and 14 593 determinant measured per year. • 25% non-compliance and ‘Polluter Pays’ principle is applied.
RETICULATION CHALLENGES • Ageing of the infrastructure(frequent analysis) • Internal coating adaptable to quality of water transported needs frequent monitoring because it can cause red water problems • Stability of water pH and Chlorine through the distribution line. • More public awareness on health and education as the society is becoming water quality aware.(e.g.Maggots Saga). • Human resources capacity to increase industrial Effluent monitoring to reduce the impact of the load on wastewater discharge. • Water pollution minimisation strategy and law enforcement
WASTEWATER • 22 Wastewater Treatment Works with monitoring programme with total samples per year=10 453 • 3 Marine Outfalls • Total 109 608 analysis measured per year • 76% compliance for 4 key paramaters with DWAF Permits for wastewater discharge.
Wastewater Challenges • Ageing, maintenance, demand of new Infra-structure • Rapid Population growth and increase in housing demand • Sewer catchment growth • Reticulation growth • Sewage spillages from over flows • Capital budget
CATCHMENT, STORMWATER &RIVER MANAGEMENT SERVICES • Rivers, vleis, and Coastal monitoring samples 310 sampling points year • Frequency is monthly and fortnightly • Total 73 240 analysis per year • Compliance is assessed by referring to DWAF Water Quality guidelines for aquatic ecosystems and for recreational use • 2004/05 CSRM Annual Report Rivers : 37 % compliance (E.coli) Vleis : 68% compliance Costal (False Bay):80% compliance
CSRM Challenges • Identify sources of point and non point source pollution • Rehabilitation of ecosystem for health improvement and minimisation of risks in human health • Co-ordination of line function within city to ensure integrated urban catchment management is effective. • Involvement communities in river management initiatives • Managing flood risks.
Internal management process on water quality • Highest qualification (PhDs ,Masters, Honours, Bachelors and Diploma in various water sciences and engineering fields • Water Quality Data in the old UNIX system is currently replaced by Newly purchased Laboratory Information Management System (LIMS)which will be live in March 2007.(Launched, June 2006) • The city’s drinking water quality has consistently achieved position 1 in SABS inter-laboratory comparison. • Launch Policy Statement (14 June 2006) its SANAS:17025 accreditation which will be completed by 2008. Legislation requires that analysis be performed in the accredited laboratory. • State of art instruments, ICP, FIA, IC TOC, UV, HPLC, ELISA
Policy statement launch 14June 2006 • Management commitment to ISO 17025 accreditation
Partnerships and Collaborations addressing Water Quality • SLA’s within internal Departments of the city • 21 W RC Steering Committee • DWAF • Community forums(Formal and Informal Settlements) • Collaboration with Western Cape academic Institutions • Collaboration with Amatola Water (Eastern Cape) • Belgium University • OSLO twinning with CoCT • Malawi twinning project with the City in the process
Volunteerism in Water Quality • Formation of Grey water project in formal and informal settlements (2006) • YES(Youth Environmental Schools) • CSRM Community Forums
Improvement on dissemination of information on water quality
HEALTH AND EDUCATION PLANS ON WATER QUALITY • 38 students graduated and done projects on water quality with the city from the past five years but not retained. • 45 Workshops held Citywide primarily in informal settlements spanning over an extensive area. (Simonstown to Atlantis) Focused Approached Understanding the cycle of WATER Actual delivery of Services Health and Hygiene issues Environmental Issues Scarcity of Water(Saving)
HELTH AND EDUCATION PLANS ON WATER QUALITY... General Water Quality provided by the City • All of the above will be addressed in a Audio Visual, intended to be complete by end July 2006
Way Forward • Prioritise and address all challenges of WATER Quality • Abstraction and Discharge • Ensuring adequate budget for infrastructure • Continuous Education and Awareness Programmes • Develop a Strategy within Water Services to ensure that skills are retained… and capacity developed. • To ensure that alignment by the City to Provisional Water Sector Plan
Conclusion Let us work together for a better city