Download
1 / 54
540 likes | 676 Vues
Biennial gathering – Urbana, IL 23 September 2004. D. G. Fautin and R. W. Buddemeier. University of Kansas: Department of Ecology and Evolutionary Biology, Natural History Museum, Kansas Geological Survey. ADDING A GEOSPATIAL COMPONENT TO A TAXON-CENTERED DATABASE. OR

E N D
Biennial gathering – Urbana, IL 23 September 2004 D. G. Fautin and R. W. Buddemeier University of Kansas: Department of Ecology and Evolutionary Biology, Natural History Museum, Kansas Geological Survey
ADDING A GEOSPATIAL COMPONENT TO A TAXON-CENTERED DATABASE OR HOW ONE PEET DATABASE GREW LIKE TOPSY
~ 1000 valid species ~ 1500 species names > 1000 type lots • from the literature • few museum data to mine • data flows to museums
Linking synonyms (through an application developed by Adorian Ardelean) allows all information for a species to be linked, regardless of the name used – but does not display data for homonymous species
IMAGES original photomicrographs of type material illustrations from original descriptions original photos of type specimens
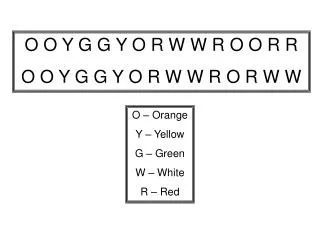
Occurrence records displayed on a map use symbols of a different color for each synonymous name. This function can be used for investigating whether a synonymy is justified.
THANK YOU, JIM and Individual, single-purpose databases are great BUT CREATING METADATABASES – BY LINKING THEM TO OTHERS -- INCREASES UTILITY, ACCESSIBILITY, and EFFECT
OCE 00-03970 allowed • Expansion to all hexacorals (including reef- forming corals, black corals, tube anemones) • Interactivity with environmental data
Biogeoinformatics of Hexacorals (http://www.kgs.ku.edu/Hexacoral/) An on-line information resource system that consists oftwo interactive databases one dealing with taxonomy and biogeography of hexacorals (sea anemones and their allies) one dealing with environmental information for the marine environmentserved by a front end that links them, andoffers user support for searching, analyzing, and downloading the data
Biennial gathering – Urbana, IL 23 September 2004 D. G. Fautin and R. W. Buddemeier University of Kansas: Department of Ecology and Evolutionary Biology, Natural History Museum, Kansas Geological Survey
--- has been combined with the taxonomic biogeographic database structure developed with NSF-PEET support to create the NSF-funded OBIS project, “Biogeoinformatics of the Hexacorallia” An example of technology transfer and integration – and an illustration of issues and needs: The environmental database, tools, and experience developed in and for the LOICZ Biogeochemistry program ---- Similarity of needs, issues, and users permits rapid progress without wheel reinvention
Data users and stakeholders • Disciplinary scientists and environmental managers • Are generally acutely interested in the nature and quality of the primary data and the availability of supporting (e.g., environmental/climatic) information AND • Commonly have relatively little interest or skill in searching for, processing, and critically interpreting datasets outside of their primary fields of training/interest. • There is a widespread and critical need for convenient, consistent access to environmental INFORMATION to support interpretation of primary biological or (e.g.) chemical DATA.
The approach evolved by LOICZ --- • Standardized tools and information to explain goals and benefits and make diverse existing datasets intercomparable • Internet-based access to the background information, tutorials, tools, and results • A series of workshops (funded) to enlist and train users and contributors, acquire data, and develop products, and test/refine tools and approaches • An environmental database that provides easy visualization, manipulation, acquisition and analysis of multiple relevant variables presented in a consistent format on a global scale • The scale (30’) and detailed contents represent compromises in the interests of global coverage, ease of use, and provision of integrated capabilities.
Envirodatabase ---- Oracle/Coldfusion A single data table with auxiliary label and management tables. World gridded into 259,200 half-degree cells – Inland, Terrestrial CZ, Coastal (shoreline), Ocean-I CZ, Ocean-II, Ocean-III. 219 variables, of which 92 are “selected” – oceanic, atmospheric, geomorphic, terrestrial, ‘human dimension,’ special applications. Relevant features: •Selectable geographic regions, • Can accommodate occurrence data directly at the 30’ scale, •Responds to occurrence locations, •Internet links to and from external applications (OBIS, others), •Extensive and growing inventory of data characterization/manipulation tools
Select variables by class, cell type, with access to variable and source metadata – cell-level measures of spatial and temporal variability are included Envirodata access: Select region by lat-long values or predefined zone; select cell type
Review and adaptation --- Selected data can be reviewed, filtered, edited, transformed, statistically analyzed, downloaded, or sent to the clustering site.
Example For a selected variable (here, SeaWifs ocean color -- chlorophyl-a band) and geographic region, cell-based summary statistics and a user-controlled histogram display provide non-spatial data visualization, and permit testing the effects of data transforms. Also available – multi-variable correlation matrix, scatterplots.
Lessons learned from LOICZ and early Hexacoral • – needs and priorities • 1. The user interface is of paramount importance; the finest data in the world are useless if people cannot readily access them, understand them, and adapt them to their individual needs. • User community -- identify and develop • User testing and feedback • User support with ultimate participation • The geographic and environmental context is what people want to know about and use; why else do we georeference? • Resolution, precision, and accuracy (reliability) are among the most important information to convey about records – these must be quantified or classified, not edited out of existence. • Users will inevitably want to manipulate and apply data in unforeseen ways – complete access combined with convenient tools for visualization and manipulation are the keys to a successful information facility.
A data summary over all cells containing a taxon record and the specified data (null values are dropped) is returned Linking biological and environmental data within “Hexacorals” and with external clients Search includes all synonyms; Environmental analyses consider only georeferenced entries
Biogeography: issues of scale and data The example of Macrodactyla doreensis (a tropical sea anemone with fish and algal symbionts) • Immediate questions – when and where were they observed? What were conditions (environment, ecosystem) then/there? How well do we know? • Extended questions (temporal scale) – what “conditions” are important? (the organisms have decade-century lifespans, so variability and extreme events are as important as averages and point measurements) -- how have conditions changed? (occurrence reports span ~170 years!)
Macrodactyla doreensis – sparse distributional data Point occurrence data convey very different impressions and types of information than do generalized range maps – how to draw the polygon?
Real Biogeography: Range, distribution controls • Geographic circumscription provides a visual clue – but not much more • What are the features common to the observed sites? (requires common, consistent database and/or working with incomplete data) • What are the biological associations? Connectivity? (requires multiparameter models, visualization – the OBIS interoperability domain) • Where else might they be found? (do we want to maximize search success or minimize exclusion – field projects or invasion concerns?) • Data verification – (e.g., bathymetry tests locational precision, since photosymbionts limit depth to <~30 m)
Tools for Biogeographic analysis • Geospatial clustering tools -- DISCO and WLV, developed by Prof. Bruce Maxwell and students, are served from Swarthmore College. • Closely linked with the Hexacoral environmental database • Support a wide range of statistical analyses and visualizations • Scale-independent • Successfully applied to questions in biogeography, biogeochemistry at continental to global scales, water resource management on a square-mile grid, and social sciences • Dynamic mapping tools – KGSMapper, developed at KGS, is served through OBIS, Hexacorallia, FishBase and, CephBase. • Uses online GIS to provide immediate links between occurrence data and environmental database • Statistical analyses permit range predictions and biogeographic analyses • An advanced prototype is being used to develop additional research tools
Geospatial Clustering: Cha et al. (Hydrobiologia, in press) used environmental clustering (below right and at bottom) and shallow-water anemone distribution records to test and modify a proposed biogeographic zonation for Korea (below left). Cluster analysis suggested different affinity groupings in the southern coast and island regions.
Simple statistics are used to identify areas of “core” environmental values and outliers
Zoom and pan functions permit viewing regions at any level of magnification (see example of Madagascar, below), and also function as data selection tools – only the points in the map view are included in the next analysis update. The prototype mapper permits display and comparison of two datasets (anemones in green, anemonefish in yellow), and also identification of conventionally assigned (red circle) or erroneous (yellow circle) locations.
A point-query feature enables the user to identify both specimens and the associated environmental variable values. Individual specimens can be edited out of the dataset, and taxon information can be accessed The environmental data can help identify points outside the known habitat limits of the organisms – for example, the anemones and anemone fish are shallow-water organisms, so any location with a minimum depth > 100 m is highly suspect.
Data filters on the variable selection tool permit the user to define the scope of the analysis in environmental space as well as in geographic and taxonomic space. Above: Anemone and Anemonefish combined dataset analyzed for ranges without editing. Below: Analysis with data filtered to include only depths <100 m. The 1 std. dev. range interval remains a good predictor even without editing. The tools permit effective use of datasets with points of mixed quality, and also provide a basis for evaluating or cleaning derivative datasets for specific uses.
Informatics –Lessons (often obvious in the abstract) Learned (usually over and over) • Appropriate questions and achievable answers change with scale -- often dramatically • If you can’t see it, it’s hard to talk about it • Uncertainty (accuracy/precision) is an essential consideration, not a dirty little secret • The best is the enemy of the good: deferring answers to the next generation is easy and unproductive – useful results with available tools and information is a better challenge Common, accessible resources and tools may meet nobody’s highest standards, but are essential to shared progress in a larger community
Biennial gathering – Urbana, IL 23 September 2004 D. G. Fautin and R. W. Buddemeier University of Kansas: Department of Ecology and Evolutionary Biology, Natural History Museum, Kansas Geological Survey
a distributed information system of systematic, ecological, and environmental data • the information component of the • the source of marine data for An On-line Atlas of Marine Diversity
The Portal *** www.iobis.org *** provides online access to: Species distribution records of high taxonomic quality Tools for effective research, management, and education • data requests and searches • network tools and models • research and education center (currently 5 million) ^ • requires taxonomically • and geospatially resolved records
data served/managed by “owner” issues of • credit • error uses GBIF standards
OBIS Search for Actinia equina
Click on map over Hawai’i -- 10° pixel
Environmental Assessment and Siting of Protected Areas Where are endangered species? What areas are important breeding grounds? Which areas are more diverse?
1872-1876 University of Kansas Digital Library Initiative to DGF, R. W. Buddemeier, S. Goodwin Thiel, with collaboration of J. Wood
Sea anemones were collected from about 31 of 504 stations RESEARCH OBJECTIVE: REASSEMBLE NET CONTENTS This will become a tool for OBIS, and is being extended to other expeditions – so data from multiple databases will interact AND entering station data will not be needed
Stations are searchable by number, date, location, and in two map forms – scanned and hot-linked images of original charts, and ArcIMS to provide data on environmental variables from point samples and other sources Prototype example
Data recorded for each station are linked to user-selectable data (>200 variables)on recent environmental conditions gridded in register at 30’ = 24.9o C
RESEARCH OBJECTIVE: COMPARE EMPIRICAL WITH MODELED DATA -- Reynolds 2o (1854-2002) and Hadley Centre 1o (1871-2002) reconstructed monthly SST averages include the Challenger years = 24.9o C To test for quality and consistency of both and provide temporal and spatial environmental connections
Interoperation• allows users to o obtain and interrelate more data o analyze those data using more tools o formulate and address broad-scale questions• avoids duplication of effort in database entry• provides a double-check on data accuracy (aids in detecting errors, inconsistencies) and thereby improves data quality• increases accessibility and reaches a broader community, bridging bio- and geo-informatics
Data in individual databases can be repurposed TAXONOMIC AUTHORITY FILES DISCREPANT NAMES HUGE ISSUE THANK YOU AGAIN, JIM Integrated Taxonomic Information System (ITIS) Species2000 = CATALOGUE OF LIFE
Biogeoinformatics of Hexacoralswww.kgs.ku.edu/Hexacoral Photograph by George Miller
Predicting Climate Change(Biogeoinformatics of Hexacorals) Triage -- rationing resources in crisis response. Focus on the least threatened and/or damaged OBIS-LOICZ