Download
1 / 26
260 likes | 458 Vues
US Oil Imports. Maj Javier Reyes (USMC) Maj Aaron Ramert (USMC ) LTJG Turgut Kaymal (Turkish Navy) June 04, 2012. BLUF. Problem:

E N D
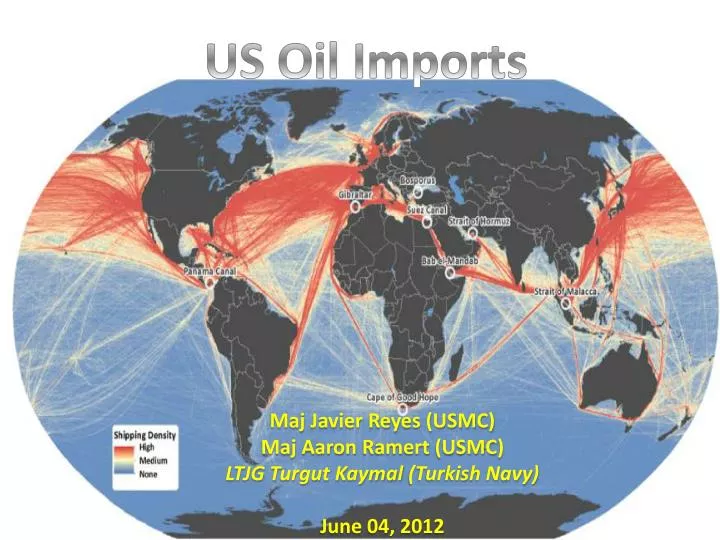
US Oil Imports Maj Javier Reyes (USMC) Maj Aaron Ramert (USMC) LTJG Turgut Kaymal (Turkish Navy) June 04, 2012
BLUF • Problem: • Due to political and civil instabilities, and natural disasters in different parts of the world. It is necessary to conduct a review and analysis of the resilience of the oil transportation network to ensure an uninterrupted and adequate flow of oil into the US. • Approach: • We approached the analysis by modeling the major transportation network with a simple minimum-cost-flow network that incorporates attacks against various edges. • Analysis of results: • The model verifies and supports other studies done with regard to the importance of world “chokepoints.” In summary, the top 3 principal strategic areas of importance were are Persian Gulf, Red Sea to Mediterranean, and Panama transit area.
Back-story • The US requires approximately 19 Million Barrels of oil per Day (MBD) and satisfies 48.6% of its consumption through domestic production (9.24 MBD.) • Of the remaining 52% of unsatisfied demand, half (5.03 MDB), is imported from the western hemisphere (Mexico, Venezuela, Canada) • The remaining 4.64 MBD are from oil exporting sources outside the western hemisphere.
Network Model • Strategic Decision Makers Problem: • Determine the flexibility of the network taking into consideration such factors as: • Ability to leverage overall supply chain capacities. • Develop strategic precedence levels for chokepoints given expected results provided through modeling the system.
Network Model • Network Abstraction: • Assumptions: • US demand will remain constant. • Foreign production of oil will have a small margin of growth. We allow for ~min(10%, amount to meet demand) • Increase only occurs after attacks • Crude and shipping prices will not change as the network is disrupted. • All shipments to the US are to the Gulf Coast. • All ships offload immediately. • An attack on any arc has an equal probability of success.
END (0,Demand,∞) START
Network Model • Measure of Effectiveness • Amount of oil imported to the US. • Cost of importing available oil to the US. • Obvious patterns of attack. • Scenario 1 • Can attack any available arc • Scenario 2 • Strait of Hormuz not able to be attacked Strait of Hormuz Saudi EW Pipeline Turkish Straits Bab El-Mandeb Suez Canal SuMed Pipeline Panama Canal Panama Pipeline Straits of Malacca
Modeling attacks on the network Attack only arcs Choke points are split into two nodes. Each attack starts from base model (simultaneous attacks) The edges have acost, lower bound, and upper bound. Strait of Hormuz Saudi EW Pipeline Turkish Straits Bab El-Mandeb Suez Canal SuMed Pipeline Panama Canal Trans-Panama Pipeline Straits of Malacca
Mathematical Model Network Abstraction using minimum-cost-flow network and simulating attacks against various edges.
Base Equation (no interdiction) • Minimizethe shipping cost • Meet demand • Dynamic capacities
Dual Equation (with interdiction) • Choose where to attack • Minimize oil flow • Maximize shipping cost
Analysis Scenario 1: Operator Resilience Curves • Total Shipping cost decrease • The interdiction plan worked in terms of increasing unsatisfied demand • With 1 attack and dynamic production, US can still meet its demand • Wıth 2 or more attacs, 10% increase in capacity did not help at all
Analysis Scenario 2 Results All possible arcs
Analysis Scenario 2: Operator Resilience Curves • Totalshipping cost fluctuates • 4% Capacity increase is enough to meet demand
Conclusion • United States can withstand an attack on the Strait of Hormuz in the short term. • When the strait and the east-west pipeline are attacked the middle east is no longer a viable source of oil and the US can not satisfy oil demand. • As long as the Strait of Hormuz remains open all other attacks are a nuisance, and drive up prices, but demand is met. You crazy Americans
Summary • The location of the attacks were as expected and show that the Strait of Hormuz is the most strategic target. • The results provide insight on potential flexibility and expected consequences in disruption of flow due to attacks. • Insight for policy and decision makers for ways ahead to add resiliency, flexibility, and alternative means to power the country.
Brazil Finds off the coast of Brazil in 2007 have increased their calculated oil reserves from 20 billion barrels to 50 billion barrels. Brazil is poised to move from the 11th largest oil producer to the 5th by 2020. But… They are some of the deepest in the world The North Sea 8,300 feet (1.5 miles) The Gulf of Mexico 16,400 feet (3 miles) Santos Basin 21,300 feet (4 miles)
Brazil Pedro Cordeiro of Bain & Company, a consultancy, says all this makes developing the pré-sal a national commitment comparable to that of the Apollo programme. In terms of cost it is actually a good bit larger. Apollo cost less than $200 billion in today’s dollars; the total bill was a few percent of America’s annual GDP at the time. Ten years’ aggressive development of the pré-salcould take a trillion dollars, around half of Brazil’s 2010 GDP. The Economist, 5 Nov 2011 http://www.economist.com/node/21536570


![[PDF] Free Download Red Metal By Mark Greaney & LtCol H. Ripley Rawlings IV, USMC](https://cdn4.slideserve.com/8388826/slide1-dt.jpg)