Download
1 / 1
10 likes | 22 Vues
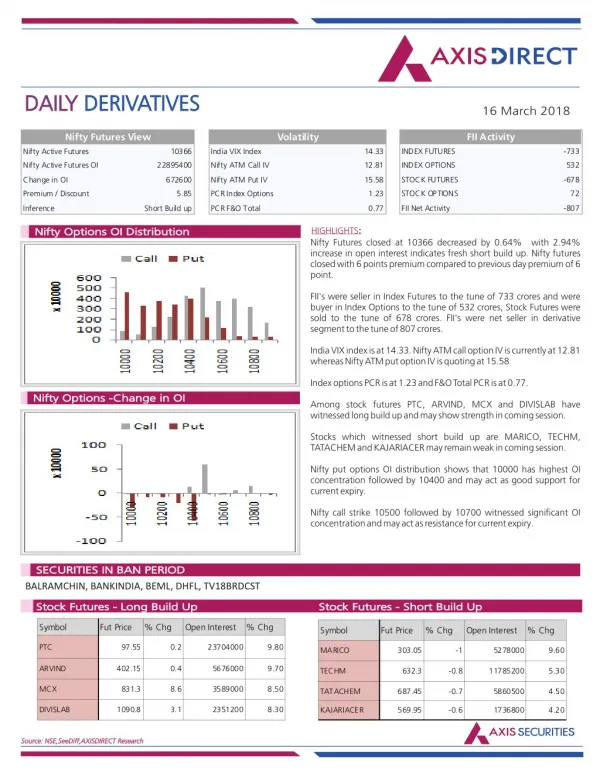
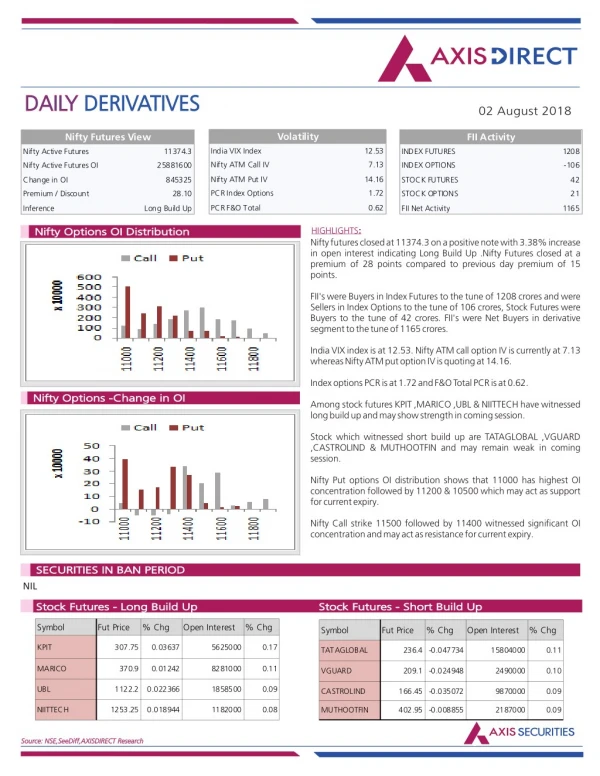
Axis Direct presents daily derivatives report presenting recommendations based on technical analysis. For trading in derivatives visit https://simplehai.axisdirect.in/offerings/products/derivatives<br>https://simplehai.axisdirect.in/share-stock-prices/nse/Bharat-Petroleum-Corporation-Ltd-2290<br>https://simplehai.axisdirect.in/share-stock-prices/nse/Coal-India-Ltd-12019<br>https://simplehai.axisdirect.in/share-stock-prices/nse/Tata-Consultancy-Services-Ltd-5400<br>https://simplehai.axisdirect.in/share-stock-prices/nse/Aurobindo-Pharma-Ltd-4666<br>

E N D
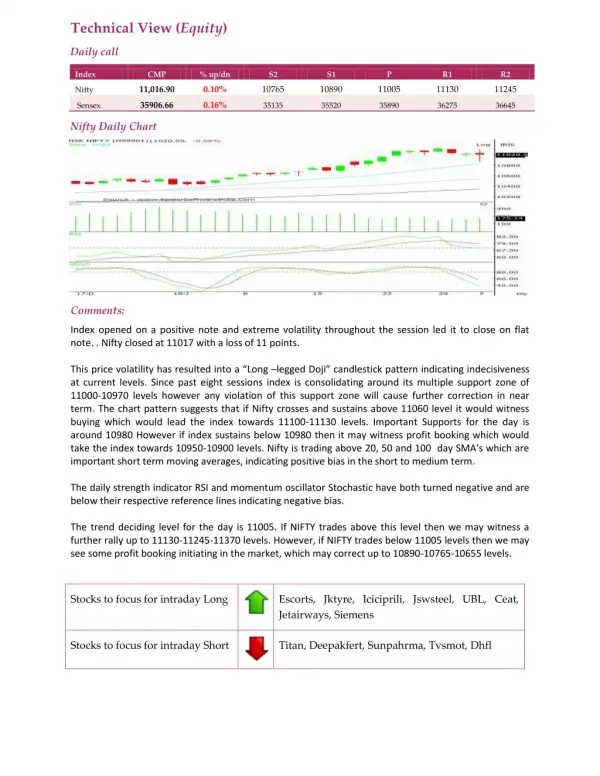
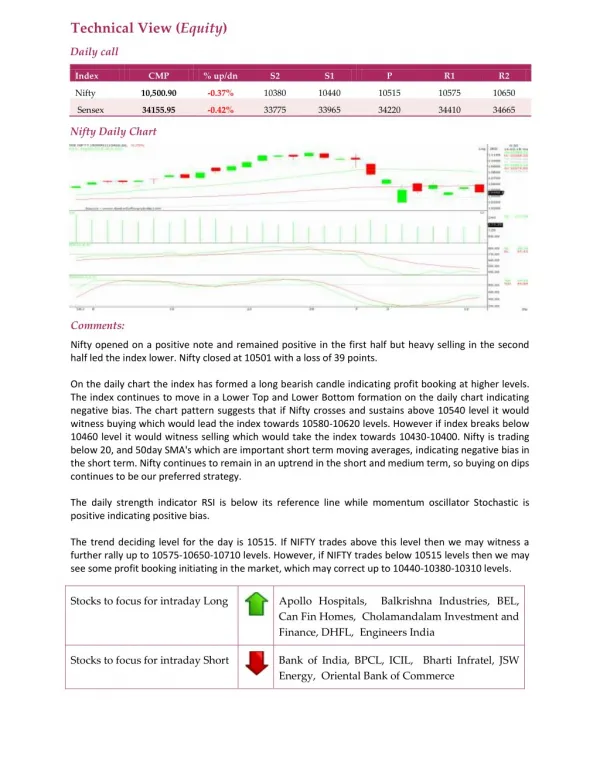
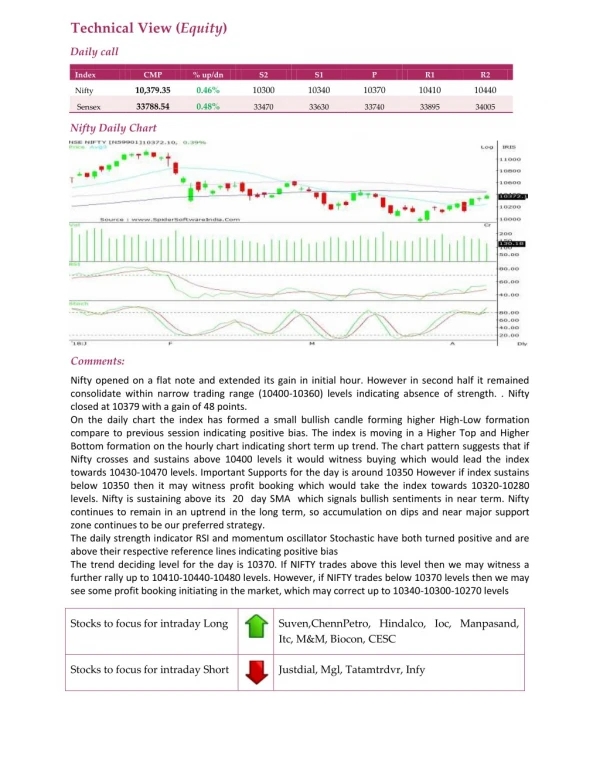
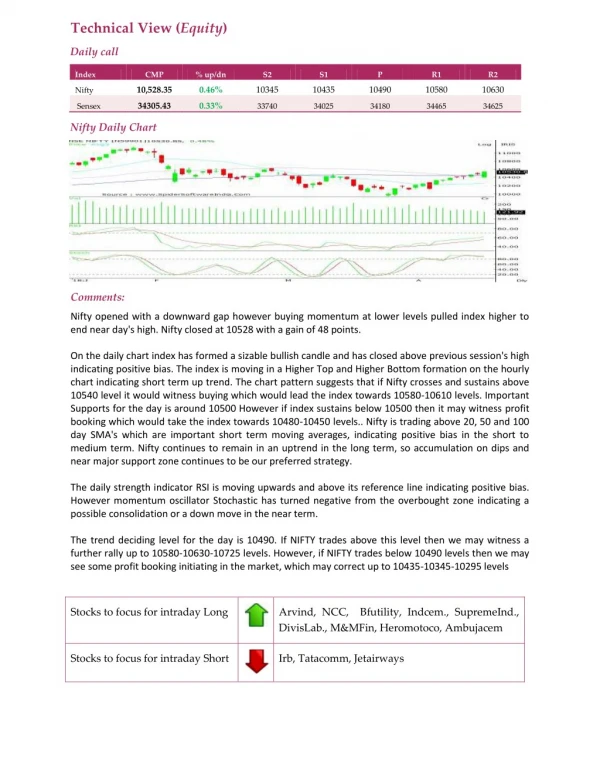
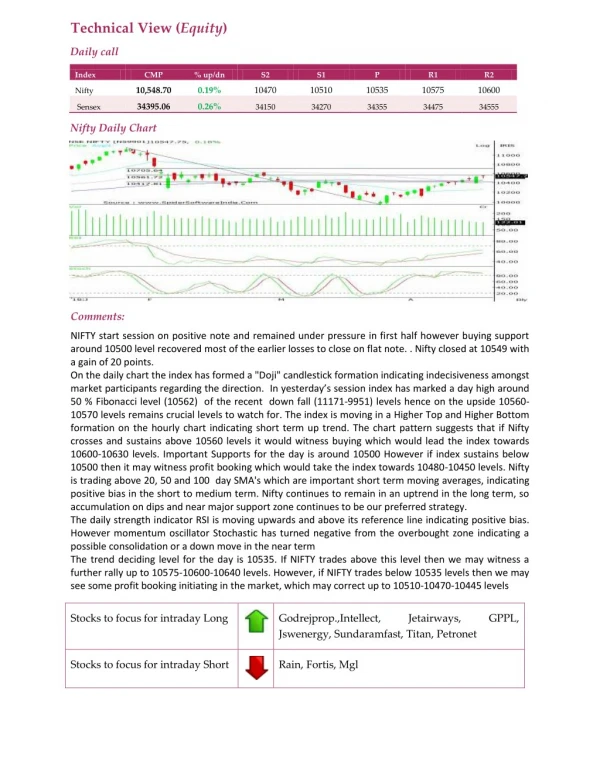
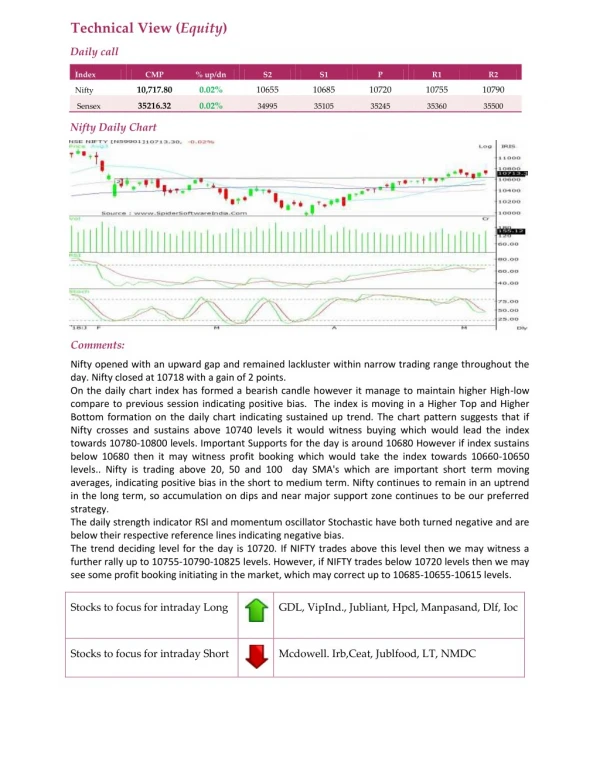
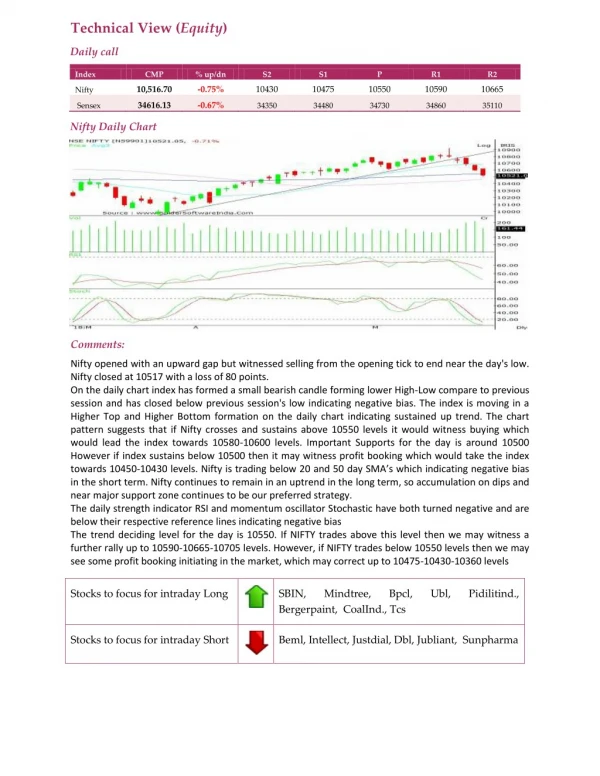
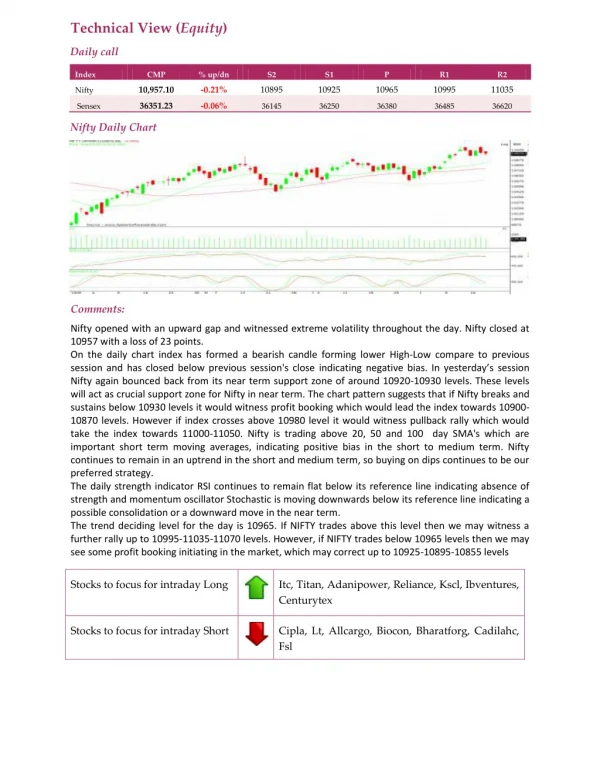
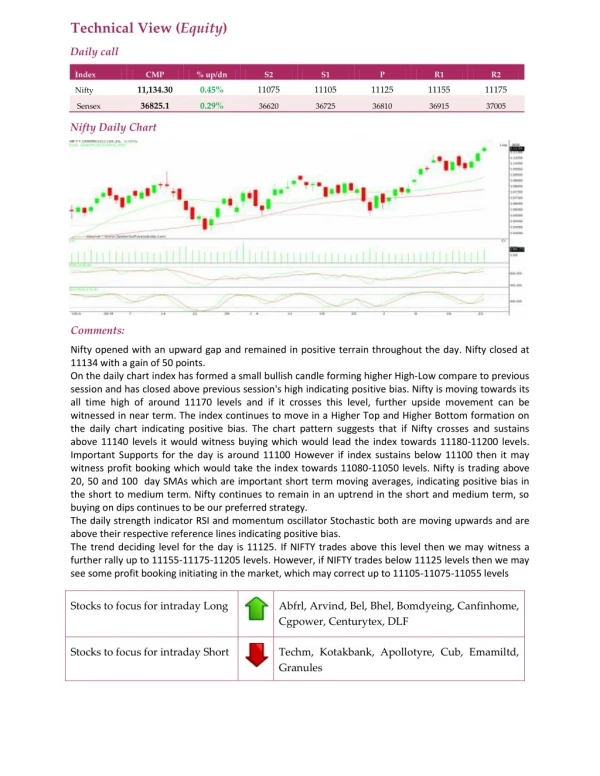
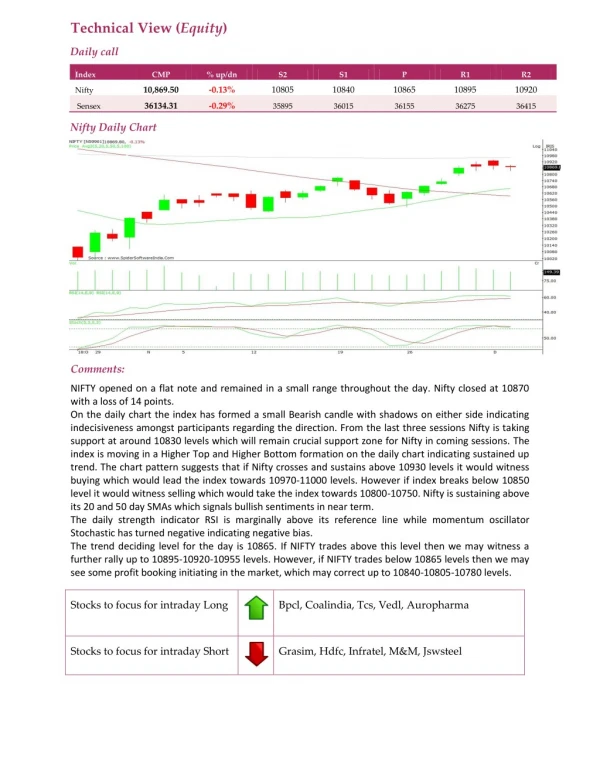
Technical View (Equity) Daily call Index CMP % up/dn S2 S1 P R1 R2 10,869.50 -0.13% 10805 10840 10865 10895 10920 Nifty 36134.31 -0.29% Sensex 35895 36015 36155 36275 36415 Nifty Daily Chart Comments: NIFTY opened on a flat note and remained in a small range throughout the day. Nifty closed at 10870 with a loss of 14 points. On the daily chart the index has formed a small Bearish candle with shadows on either side indicating indecisiveness amongst participants regarding the direction. From the last three sessions Nifty is taking support at around 10830 levels which will remain crucial support zone for Nifty in coming sessions. The index is moving in a Higher Top and Higher Bottom formation on the daily chart indicating sustained up trend. The chart pattern suggests that if Nifty crosses and sustains above 10930 levels it would witness buying which would lead the index towards 10970-11000 levels. However if index breaks below 10850 level it would witness selling which would take the index towards 10800-10750. Nifty is sustaining above its 20 and 50 day SMAs which signals bullish sentiments in near term. The daily strength indicator RSI is marginally above its reference line while momentum oscillator Stochastic has turned negative indicating negative bias. The trend deciding level for the day is 10865. If NIFTY trades above this level then we may witness a further rally up to 10895-10920-10955 levels. However, if NIFTY trades below 10865 levels then we may see some profit booking initiating in the market, which may correct up to 10840-10805-10780 levels. Stocks to focus for intraday Long Bpcl, Coalindia, Tcs, Vedl, Auropharma Stocks to focus for intraday Short Grasim, Hdfc, Infratel, M&M, Jswsteel