Daily Technical Report:09 August 2018
10 likes | 47 Vues
Axis Direct presents daily derivatives report presenting recommendations based on technical analysis. For trading in derivatives visit https://simplehai.axisdirect.in/offerings/products/derivatives<br>https://simplehai.axisdirect.in/share-stock-prices/nse/Cipla-Ltd-114<br>https://simplehai.axisdirect.in/share-stock-prices/nse/ICICI-Bank-Ltd-5418<br>https://simplehai.axisdirect.in/share-stock-prices/nse/Oil-&-Natural-Gas-Corpn-Ltd-6068<br>https://simplehai.axisdirect.in/share-stock-prices/nse/Ashok-Leyland-Ltd-31<br>https://simplehai.axisdirect.in/share-stock-prices/nse/Bharat-Petroleum-Corporation-Ltd-2290<br>https://simplehai.axisdirect.in/share-stock-prices/nse/Lupin-Ltd-3026<br>https://simplehai.axisdirect.in/share-stock-prices/nse/Aurobindo-Pharma-Ltd-4666

Daily Technical Report:09 August 2018
E N D
Presentation Transcript
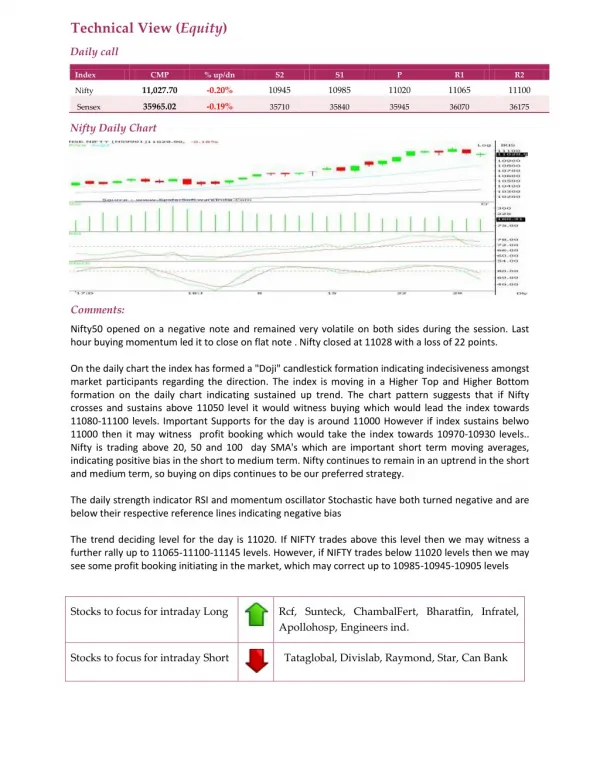
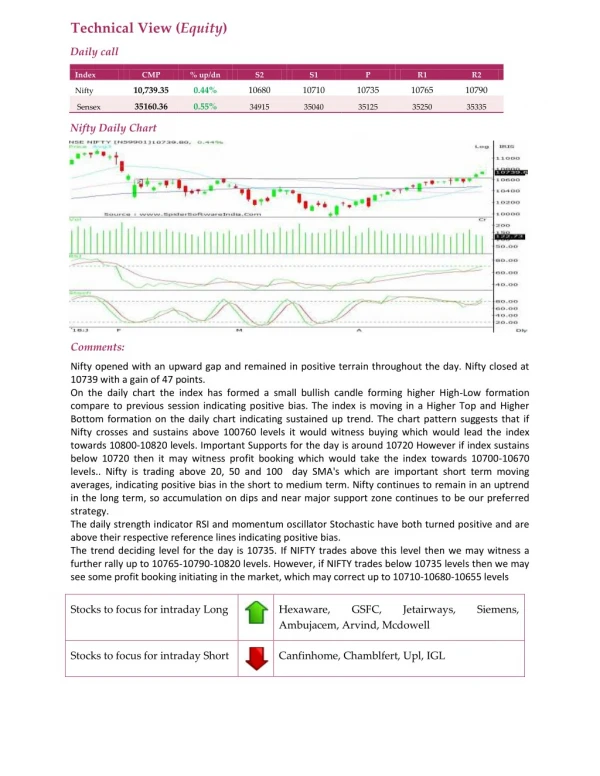
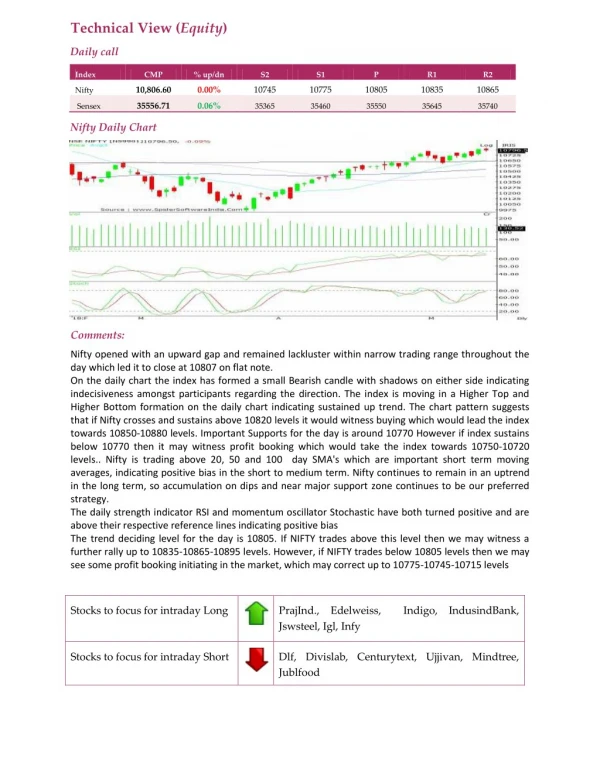
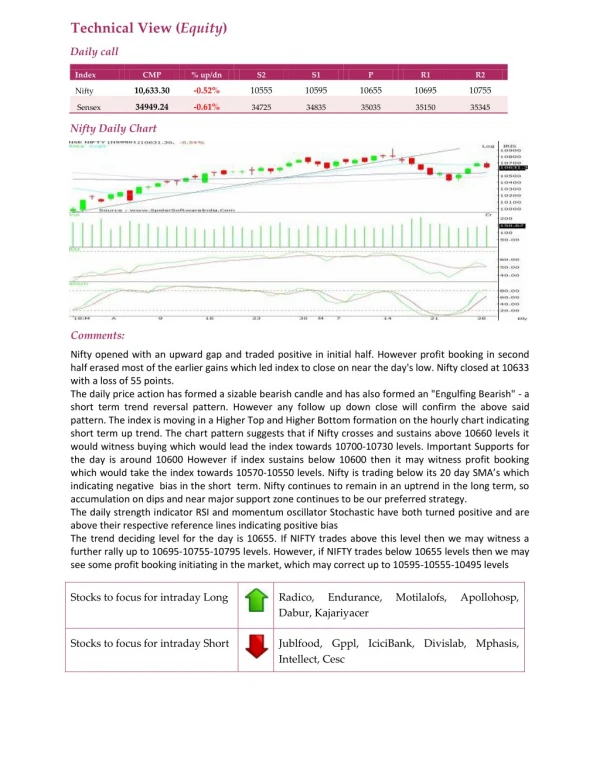
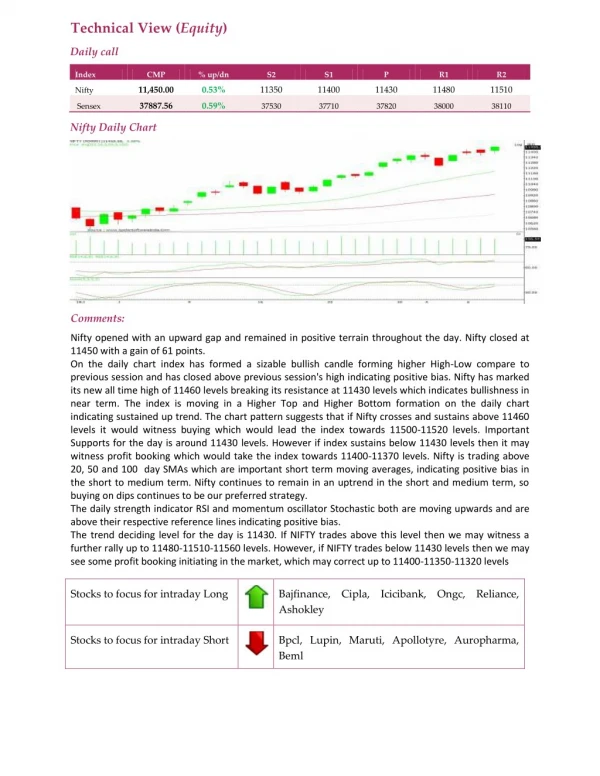
Technical View (Equity) Daily call Index CMP % up/dn S2 S1 P R1 R2 11,450.00 0.53% 11350 11400 11430 11480 11510 Nifty 37887.56 0.59% Sensex 37530 37710 37820 38000 38110 Nifty Daily Chart Comments: Nifty opened with an upward gap and remained in positive terrain throughout the day. Nifty closed at 11450 with a gain of 61 points. On the daily chart index has formed a sizable bullish candle forming higher High-Low compare to previous session and has closed above previous session's high indicating positive bias. Nifty has marked its new all time high of 11460 levels breaking its resistance at 11430 levels which indicates bullishness in near term. The index is moving in a Higher Top and Higher Bottom formation on the daily chart indicating sustained up trend. The chart pattern suggests that if Nifty crosses and sustains above 11460 levels it would witness buying which would lead the index towards 11500-11520 levels. Important Supports for the day is around 11430 levels. However if index sustains below 11430 levels then it may witness profit booking which would take the index towards 11400-11370 levels. Nifty is trading above 20, 50 and 100 day SMAs which are important short term moving averages, indicating positive bias in the short to medium term. Nifty continues to remain in an uptrend in the short and medium term, so buying on dips continues to be our preferred strategy. The daily strength indicator RSI and momentum oscillator Stochastic both are moving upwards and are above their respective reference lines indicating positive bias. The trend deciding level for the day is 11430. If NIFTY trades above this level then we may witness a further rally up to 11480-11510-11560 levels. However, if NIFTY trades below 11430 levels then we may see some profit booking initiating in the market, which may correct up to 11400-11350-11320 levels Stocks to focus for intraday Long Bajfinance, Cipla, Icicibank, Ongc, Reliance, Ashokley Stocks to focus for intraday Short Bpcl, Lupin, Maruti, Apollotyre, Auropharma, Beml