Download
1 / 1
10 likes | 26 Vues
Axis Direct presents daily derivatives report presenting recommendations based on technical analysis. For trading in derivatives visit https://simplehai.axisdirect.in/offerings/products/derivatives<br>https://simplehai.axisdirect.in/share-stock-prices/nse/Tech-Mahindra-Ltd-17215<br>

E N D
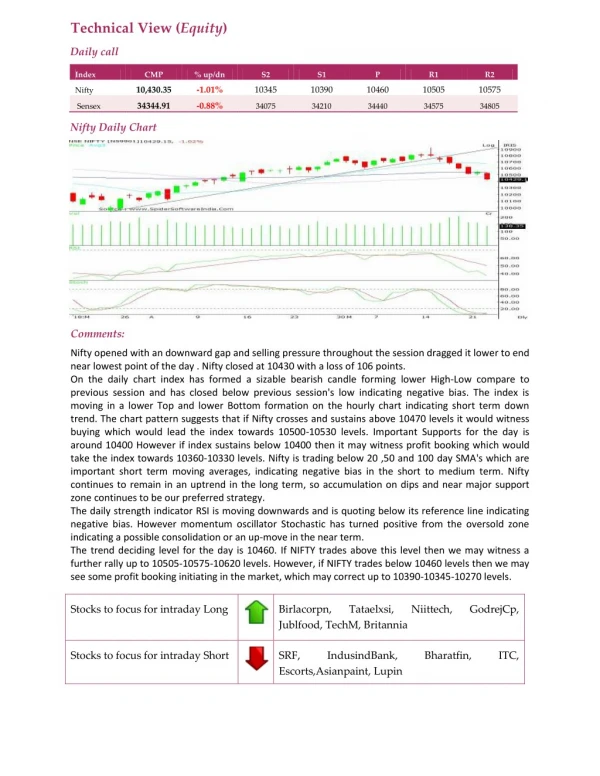
Technical View (Equity) Daily call Index CMP % up/dn S2 S1 P R1 R2 10,430.35 -1.01% 10345 10390 10460 10505 10575 Nifty 34344.91 -0.88% Sensex 34075 34210 34440 34575 34805 Nifty Daily Chart Comments: Nifty opened with an downward gap and selling pressure throughout the session dragged it lower to end near lowest point of the day . Nifty closed at 10430 with a loss of 106 points. On the daily chart index has formed a sizable bearish candle forming lower High-Low compare to previous session and has closed below previous session's low indicating negative bias. The index is moving in a lower Top and lower Bottom formation on the hourly chart indicating short term down trend. The chart pattern suggests that if Nifty crosses and sustains above 10470 levels it would witness buying which would lead the index towards 10500-10530 levels. Important Supports for the day is around 10400 However if index sustains below 10400 then it may witness profit booking which would take the index towards 10360-10330 levels. Nifty is trading below 20 ,50 and 100 day SMA's which are important short term moving averages, indicating negative bias in the short to medium term. Nifty continues to remain in an uptrend in the long term, so accumulation on dips and near major support zone continues to be our preferred strategy. The daily strength indicator RSI is moving downwards and is quoting below its reference line indicating negative bias. However momentum oscillator Stochastic has turned positive from the oversold zone indicating a possible consolidation or an up-move in the near term. The trend deciding level for the day is 10460. If NIFTY trades above this level then we may witness a further rally up to 10505-10575-10620 levels. However, if NIFTY trades below 10460 levels then we may see some profit booking initiating in the market, which may correct up to 10390-10345-10270 levels. Stocks to focus for intraday Long Birlacorpn, Jublfood, TechM, Britannia Tataelxsi, Niittech, GodrejCp, Stocks to focus for intraday Short SRF, Escorts,Asianpaint, Lupin IndusindBank, Bharatfin, ITC,