Daily Technical Report:29 May 2018
10 likes | 34 Vues
Axis Direct presents daily derivatives report presenting recommendations based on technical analysis. For trading in derivatives visit https://simplehai.axisdirect.in/offerings/products/derivatives<br>https://simplehai.axisdirect.in/share-stock-prices/nse/Delta-Corp-Ltd-17211<br>https://simplehai.axisdirect.in/share-stock-prices/nse/Lupin-Ltd-3026<br>

Daily Technical Report:29 May 2018
E N D
Presentation Transcript
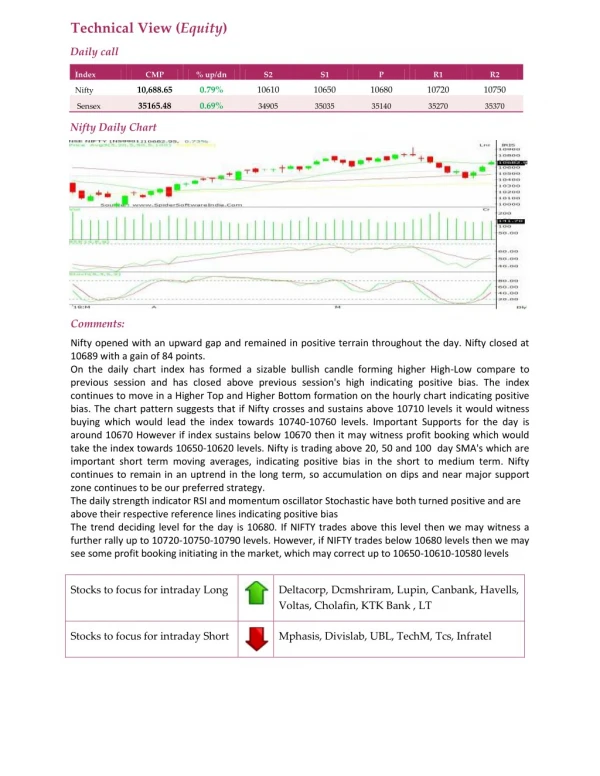
Technical View (Equity) Daily call Index CMP % up/dn S2 S1 P R1 R2 10,688.65 0.79% 10610 10650 10680 10720 10750 Nifty 35165.48 0.69% Sensex 34905 35035 35140 35270 35370 Nifty Daily Chart Comments: Nifty opened with an upward gap and remained in positive terrain throughout the day. Nifty closed at 10689 with a gain of 84 points. On the daily chart index has formed a sizable bullish candle forming higher High-Low compare to previous session and has closed above previous session's high indicating positive bias. The index continues to move in a Higher Top and Higher Bottom formation on the hourly chart indicating positive bias. The chart pattern suggests that if Nifty crosses and sustains above 10710 levels it would witness buying which would lead the index towards 10740-10760 levels. Important Supports for the day is around 10670 However if index sustains below 10670 then it may witness profit booking which would take the index towards 10650-10620 levels. Nifty is trading above 20, 50 and 100 day SMA's which are important short term moving averages, indicating positive bias in the short to medium term. Nifty continues to remain in an uptrend in the long term, so accumulation on dips and near major support zone continues to be our preferred strategy. The daily strength indicator RSI and momentum oscillator Stochastic have both turned positive and are above their respective reference lines indicating positive bias The trend deciding level for the day is 10680. If NIFTY trades above this level then we may witness a further rally up to 10720-10750-10790 levels. However, if NIFTY trades below 10680 levels then we may see some profit booking initiating in the market, which may correct up to 10650-10610-10580 levels Stocks to focus for intraday Long Deltacorp, Dcmshriram, Lupin, Canbank, Havells, Voltas, Cholafin, KTK Bank , LT Stocks to focus for intraday Short Mphasis, Divislab, UBL, TechM, Tcs, Infratel