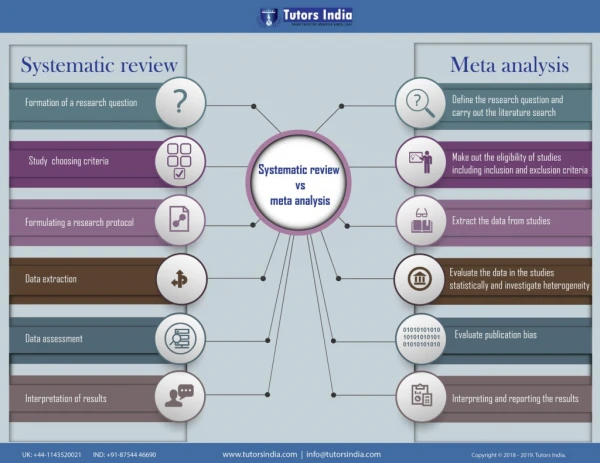
Data Analysis in Systematic Reviews-Meta Analysis
Data Analysis in Systematic Reviews-Meta Analysis. Central questions of interest. Are the results of the studies fairly similar (consistent)?. Yes. No. What is the common, summary effect?. What factors can explain the dissimilarities (heterogeneity) in the study results?.


Data Analysis in Systematic Reviews-Meta Analysis
E N D
Presentation Transcript
Central questions of interest Are the results of the studies fairly similar (consistent)? Yes No What is the common, summary effect? What factors can explain the dissimilarities (heterogeneity) in the study results? How precise is the common, summary effect?
Steps in data analysis & presentation • Tabulate summary data • Graph data • Check for heterogeneity • Perform a meta-analysis if heterogeneity is not a major concern • If heterogeneity is found, identify factors that can explain it • Evaluate the impact of study quality on results • Explore the potential for publication bias
1. Tabulate summary data • Prepare tables comparing studies with respect to: • Year • Setting • Patients • Intervention • Comparison • Outcome (results) • Quality • Gives a ‘first hand’ feel for the data • Can make some assessment of quality and heterogeneity
Tabulate summary dataExample: Cochrane albumin review Cochrane Injuries Group Albumin Reviewers. Human albumin administration in critically ill patients: systematic review of randomised controlled trials. BMJ 1998;317:235-40.
2. Graph summary data • Efficient way of presenting summary results • Forest plot: • Presents the point estimate and CI of each trial • Also presents the overall, summary estimate • Allows visual appraisal of heterogeneity • Other graphs: • Cumulative meta-analysis • Funnel plot for publication bias
Forest Plot Cochrane albumin review BMJ 1998;317:235-240
Cumulative Meta-analysis Plot Passive smoking and lung cancer review Hackshaw AK et al. BMJ 1997;315:980-88.
3. Check for heterogeneity • Indicates that effect varies a lot across studies • If heterogeneity is present, a common, summary measure is hard to interpret • Can be due to due to differences in: • Patient populations studied • Interventions used • Co-interventions • Outcomes measured • Study design features (eg. length of follow-up) • Study quality • Random error
3. Check for heterogeneity • How to look for heterogeneity? • Visual • Forest plot: do confidence intervals of studies overlap with each other and the summary effect? • Statistical tests: • Chi-square test for heterogeneity (Cochran Q test) • Tests whether the individual effects are farther away from the common effect, beyond what is expected by chance • Has poor power • P-value < 0.10 indicates significant heterogeneity
Visual appraisal of heterogeneity Zinc for common cold: Summary and incidence odds ratios for the incidence of any cold symptom at 1 wk Jackson JL, et al. Zinc and the common cold: a meta-analysis revisited. J of Nutrition. 2000;130:1512S-1515S
Pooled Se = 0.71 Heterogeneity p<0.001 Pooled Sp = 0.95 Heterogeneity p<0.001 Pai M, et al. Comparison of diagnostic accuracy of commercial and in-house nucleic acid amplification tests for tuberculous meningitis: a meta-analysis. Poster presented at the American Society for Microbiology, 2003
3. Check for heterogeneity • If significant heterogeneity is found: • Find out what factors might explain the heterogeneity • Can decide not to combine the data • If no heterogeneity: • Can perform meta-analysis and generate a common, summary effect measure
4. Perform meta-analysis • Decide what data to combine • Data types: • Continuous • Dichotomous • Examples of measures that can be combined: • Risk ratio • Odds ratio • Risk difference • Effect size (Z statistic; standardized mean difference) • P-values • Correlation coefficient (R) • Sensitivity & Specificity of a diagnostic test
4. Perform meta-analysis • Statistical models for combining data: • All methods essentially compute weighted averages • Weighting factor is often the study size • Models: • Fixed effects model • Inverse-variance, Peto method, M-H method • Random effects model • DerSimonian & Laird method
4. Perform meta-analysis • Statistical models for combining data: • Fixed effects model • it is assumed that the true effect of treatment is the same value in each study (fixed); the differences between studies is solely due to random error • Random effects model • the treatment effects for the individual studies are assumed to vary around some overall average treatment effect • Allows for random error plus inter-study variability • Results in wider confidence intervals (conservative) • Studies tend to be weighted more equally (relatively more weight is given to smaller studies)
4. Perform meta-analysis Moher D et al. Arch Pediatr Adolesc Med 1998;152:915-20
5. Identify factors that can explain heterogeneity • If heterogeneity is found, use these approaches to identify factors that can explain it: • Graphical methods • Subgroup analysis • Sensitivity analysis • Meta-regression • Of all these approaches, subgroup analysis is easily done and interpreted
Subgroup analysis: example • Egger et al. Systematic reviews in health care. London: BMJ books, 2001.
Pooled Se = 0.56 Heterogeneity p = 0.10 Pooled Sp = 0.98 Heterogeneity p = 0.10 Se and Sp estimates (with CI) for only commercial tests [N=14] Pai M, et al. Comparison of diagnostic accuracy of commercial and in-house nucleic acid amplification tests for tuberculous meningitis: a meta-analysis. Poster presented at the American Society for Microbiology, 2003
Pooled Se = 0.76 Heterogeneity p <0.001 Pooled Sp = 0.92 Heterogeneity p <0.001 Se and Sp estimates (with CI) for only in-housetests [N=35] Pai M, et al. Comparison of diagnostic accuracy of commercial and in-house nucleic acid amplification tests for tuberculous meningitis: a meta-analysis. Poster presented at the American Society for Microbiology, 2003
6. Evaluate impact of study quality on results • Narrative discussion of impact of quality on results • Display study quality and results in a tabular format • Weight the data by quality (not recommended) • Subgroup analysis by quality • Include quality as a covariate in meta-regression
7. Explore publication bias • Studies with significant results are more likely • to be published • to be published in English • to be cited by others • to produce multiple publications • Including only published studies can introduce publication bias • Most reviews do not look for publication bias • Methods for detecting publication bias: • Graphical: funnel plot asymmetry • Tests: Egger test, Rosenthal’s Fail-safe N
Funnel plot to detect publication bias • Egger et al. Systematic reviews in health care. London: BMJ books, 2001.
Meta-analysis Software • Free • RevMan [Review Manager] • Meta-Analyst • Epi Meta • Easy MA • Meta-Test • Meta-Stat • Commercial • Comprehensive Meta-analysis • Meta-Win • WEasy MA • General stats packages • Stata • SAS • S-Plus http://www.prw.le.ac.uk/epidemio/personal/ajs22/meta/