META-ANALYSIS AND SYSTEMATIC REVIEW
680 likes | 900 Vues
META-ANALYSIS AND SYSTEMATIC REVIEW. Gianluigi Savarese, MD, FESC, ACC FIT Department of Advanced Biomedical Sciences, Federico II University, Naples, Italy Department of Medicine, Solna, Karolinska Institutet, Stockholm, Sweden. What is a Systematic Review?.

META-ANALYSIS AND SYSTEMATIC REVIEW
E N D
Presentation Transcript
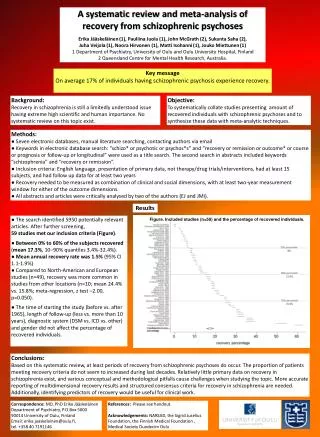
META-ANALYSIS AND SYSTEMATIC REVIEW Gianluigi Savarese, MD, FESC, ACC FIT Department of Advanced Biomedical Sciences, Federico II University, Naples, Italy Department of Medicine, Solna, Karolinska Institutet, Stockholm, Sweden
What is a Systematic Review? “A review that is conducted according to clearly stated, scientific research methods, and is designed to minimize biases and errors inherent to traditional, narrative reviews.” Kevin C. Chung, MD, Patricia B. Burns, MPH, H. Myra Kim, ScD, “Clinical Perspective: A Practical Guide to Meta-Analysis.” The Journal of Hand Surgery. Vol. 31A No.10 December 2006. p.1671
What is the significance of Systematic Reviews? • The large amount of medical literature requires clinicians and researchers alike to rely on systematic reviews in order to make an informed decision. • Systematic Reviews minimize bias. “A systematic review is a more scientific method of summarizing literature because specific protocols are used to determine which studies will be included in the review.” Margaliot, Zvi, Kevin C. Chung. “Systematic Reviews: A Primer for Plastic Surgery Research.” PRS Journal. 120/7 (2007) p.1839
Why are Systematic Reviews Necessary? “The volume of published material makes it impractical for an individual clinician to remain up to date on a variety of common conditions. This is further complicated when individual studies report conflicting conclusions, a problem that is prevalent when small patient samples and retrospective designs are used.” Margaliot, Zvi, Kevin C. Chung. “Systematic Reviews: A Primer for Plastic Surgery Research.” PRS Journal. 120/7 (2007) p.1839
Characteristics of Systematic Reviews • Two possible approaches: • or qualitative synthesis • statistical synthesis of data (meta-analysis) if appropriate and possible
Hypothesis A systematic review should be based on principles of hypothesis testing, and the hypotheses must be conceived a priori.
Four steps • Identify your studies • Determine eligibility of studies apriori to avoid bias • Inclusion: which ones to keep • Exclusion: which ones to throw out • Abstract Data from the studies • Analyze data in the studies statistically
Literature Search A comprehensive and reproducible literature search is the foundation of a systematic review.
Literature Search • Be methodical: plan first • List of popular databases to search • Pubmed/Medline • Embase • Cochrane Review • ISI Web of Science • SCOPUS • Other strategies you may adopt • Trial registries (clinicaltrials.gov) • Abstracts from meetings • Hand search (go to the library...) • Personal references • References from published reviews/meta-analysis/trials • Contact experts • Web, eg. Google (http://scholar.google.com) Database bias!!! Grey litterature
Literature Search – Risk of Bias • English-language bias - occurs when reviewers exclude papers published in languages other than English • Citation bias - occurs when studies with significant or positive results are referenced in other publications, compared with studies with inconclusive or negative findings • Publication Bias - selective publication of articles that show positive treatment of effects and statistical significance.
Data Collection • The list of data to be extracted should be decided a priori. • A data extraction form should be used so that the same data are extracted from each study and missing data are clearly apparent. • To be sure that data extraction is accurate and reproducible, it should be performed by at least two independent readers. • Disagreement between readers could be solved by agreements or by a third reviewer Margaliot, Zvi, Kevin C. Chung. “Systematic Reviews: A Primer for Plastic Surgery Research.” PRS Journal. 120/7 (2007) p.1839
Data Collection Collected data includes: • Study characteristics (year and journal of publication, number of patients in each arm, treatments performed, duration of follow-up) • Sample demographics (age, % males or females) • Sample characteristics (traditional CV risk factors - % hypertensive pts, % diabetic pts, % dyslipidemicpts, % smokers – concomitant treatments, comorbidities, etc) • Outcome data (all-cause death, CV death, MI, stroke, etc)
Quality Assessment The validity of a systematic review ultimately depends on the scientific method of the retrieved studies and the reporting of data.” Margaliot, Zvi, Kevin C. Chung. “Systematic Reviews: A Primer for Plastic Surgery Research.” PRS Journal. 120/7 (2007) p.1839
GRADE Grading of Recommendations Assessment, Development and Evaluation Guyatt GH, Oxman AD, Kunz R, Vist GE, Falck-Ytter Y, Schünemann HJ; GRADE Working Group. What is "quality of evidence" and why is it important to clinicians? BMJ. 2008 May 3;336(7651):995-8.
Guyatt GH, Oxman AD, Kunz R, Vist GE, Falck-Ytter Y, Schünemann HJ; GRADE Working Group. What is "quality of evidence" and why is it important to clinicians? BMJ. 2008 May 3;336(7651):995-8.
Data Synthesis Data could be summarized quantitatively if study designs are not too different in: • outcome definition (composite outcome?); • population sizes • population characteristics • interventions HETEROGENEITY
Data Synthesis Once the data have been extracted and their quality and validity assessed, the outcomes of individual studies within a systematic review may be pooled and presented as summary outcome or effect META-ANALYSIS
What is meta analysis? Quantitativeapproach forsystematically combiningresults ofprevious researchto arrive at conclusionsabout the body of research.
What does it mean? • Quantitative : numbers • Systematic : methodical • combining: putting together • previous research: what's already done • conclusions: new knowledge
Meta-analysis: Statistical Models • There are 2 statistical models used in a meta-analysis: • Fixed effects: • Effect of treatment is the same for every study; • Low heterogeneity • Random effects: • True effect estimate for each study varies; • High heterogeneity • Provide larger CI
Heterogeneity • Clinical heterogeneity: variability in the participants, interventions and outcomes studied + • Methodological heterogeneity: variability in study design • Statistical heterogeneity: Variability in the intervention effects being evaluated in the different studies. It is a consequence of clinical or methodological diversity, or both, among the studies. Higgins JPT, Green S (editors). Cochrane Handbook for Systematic Reviews of Interventions Version 5.1.0 [updated March 2011]. The Cochrane Collaboration, 2011. Available from www.cochrane-handbook.org.
Heterogeneity assessment • If confidence intervals for the results of individual studies (generally depicted graphically using horizontal lines) have poor overlap, this generally indicates the presence of statistical heterogeneity. • Cochrane Q statistic: It is calculated as the weighted sum of squared differences between individual study effects and the pooled effect across studies, with the weights being those used in the pooling method. A p value decided apriori defines the presence of significant heterogeneity. • I2 statistic: It describes the percentage of variation across studies that is due to heterogeneity rather than chance. • 0% to 40%: heterogeneity might not be important; • 30% to 60%: may represent moderate heterogeneity; • 50% to 90%: may represent substantial heterogeneity; • 75% to 100%: considerable heterogeneity. Higgins JPT, Green S (editors). Cochrane Handbook for Systematic Reviews of Interventions Version 5.1.0 [updated March 2011]. The Cochrane Collaboration, 2011. Available from www.cochrane-handbook.org.
Strategies for addressing heterogeneity • Check again that the data are correct • Do not do a meta-analysis • Explore heterogeneity (subgroup analysis, meta-regression) • Ignore heterogeneity (there is no an intervention effect but a distribution of intervention effects) • Perform a random-effects meta-analysis (when heterogeneity cannot be explained) • Change the effect measure (different scales in different studies) • Exclude studies (outlying studies) Higgins JPT, Green S (editors). Cochrane Handbook for Systematic Reviews of Interventions Version 5.1.0 [updated March 2011]. The Cochrane Collaboration, 2011. Available from www.cochrane-handbook.org.
Sensitivity analysis • One study removed meta-analysis • Meta-regression analysis
Publication Bias Publication bias arises when trials with statistically significant results are more likely to be published and cited, and are preferentially published in English language journals and those indexed in Medline Jüni P, Holenstein F, Sterne J, Bartlett C, Egger M. Direction and impact of language bias in meta-analyses of controlled trials: empirical study. International Journal of Epidemiology 2001;31:115-123.
Publication Bias • A funnel plot is a simple scatter plot of the intervention effect estimates (OR, logOR) from individual studies against some measure of each study’s size or precision (standard error, 1/standard error, sample size, 1/sample size, log(sample size), log(1/sample size), Mantel-Haenszel weight). • The best choice of x axis for detecting the small sample effect is the log odds ratio. This is because the scale is not constrained and because the plot will be the same shape whether the outcome is defined as occurrence or non-occurrence of event. Sterne JAC, Egger M. Funnel plots for detecting bias in meta-analysis: Guidelines on choice of axis. Journal of Clinical Epidemiology 2001;54:1046-1055.
Symmetrical plot in the absence of bias (open circles indicate smaller studies showing no beneficial effects) Asymmetrical plot in the presence of publication bias (smaller studies showing no beneficial effects are missing) Asymmetrical plot in the presence of bias due to low methodological quality of smaller studies (open circles indicate small studies of inadequate quality whose results are biased towards larger beneficial effects) Jonathan A et al. The Stata Journal 2004; 4:127
Publication Bias Ntot is the total sample size, NE and NC are the sizes of the experimental and control intervention groups, S is the total number of events across both groups and F = Ntot – S. Note that only the first three of these tests (Begg 1994, Egger 1997a, Tang 2000) can be used for continuous outcomes.
Protocols The purpose of PRISMA (Preferred Reporting Items for Systematic Reviews and Meta-Analyses) guidelines is to provide proper procedures for conducting a meta-analysis and to standardize the methods of reporting a meta-analysis.
Background • Angiotensin-converting enzyme inhibitors (ACE-Is) are recommended for reduction of cardiovascular (CV) events in patients at high CV risk without heart failure (HF). • In contrast, CV effects of angiotensin receptor blockers (ARBs) on major clinical outcomes in patients without HF are less certain as major clinical trials comparing ARBs vs placebo reported conflicting results. Savarese G et al J Am Coll Cardiol 2013;61:131
Methods – Inclusion Criteria Report of at least one clinical outcome (all-cause death, CV death, myocardial infarction, stroke, new onset heart failure, new onset diabetes mellitus). Randomized, placebo-controlled trials using ACE-Is or ARBs as treatments. Savarese G et al J Am Coll Cardiol 2013;61:131
Methods – Statistical methods Meta-analysis was performed to assess the influence of treatments on outcomes. Statistical homogeneity was assessed using Q statistic and further quantified with the I2 statistic. Meta-regression was performed to test the influence of potential effect modifiers on results. Publication bias was assessed using linear regression test by Egger and Macaskill’s modified test. Savarese G et al J Am Coll Cardiol 2013;61:131
Results – Search Strategy Savarese G et al J Am Coll Cardiol 2013;61:131
Results – Composite Outcome ARBs significantly reduced the risk of the composite outcome by 7.0% compared to placebo (p=0.012). ACE-Is significantly reduced the risk of the composite outcome by 14.9% compared to placebo (p=0.001). Savarese G et al J Am Coll Cardiol 2013;61:131
Results – CV Death ARBs did not reduce the risk of CV death (p=0.768) 10% reduction of CV death did not achieve statistical significance in ACE-Is trials (p=0.087). Savarese G et al J Am Coll Cardiol 2013;61:131
Results – Myocardial infarction 9.5% reduction of MI risk did not achieve statistical significance in ARBs trials (p=0.086). ACE-Is significantly reduced the risk of MI by 17.7% (p<0.001) Savarese G et al J Am Coll Cardiol 2013;61:131
Results – Stroke ARBs significantly reduced the risk of stroke by 9.1% (p=0.011). ACE-Is significantly reduced the risk of stroke by 19.6% (p=0.004) Savarese G et al J Am Coll Cardiol 2013;61:131
Results – All Cause Death No significant effect was found on the risk of all-cause death in ARBs trials (p=0.866). ACE-Is reduced the risk of all-cause death by 8.3% (p=0.008). Savarese G et al J Am Coll Cardiol 2013;61:131
Results – New onset HF No significant effect was found on the risk of new onset HF in ARBs trials (p=0.866). ACE-Is reduced the risk of new onset HF by 20.5% (p=0.001). Savarese G et al J Am Coll Cardiol 2013;61:131
Results – New onset DM ARBs significantly reduced the risk of new onset DM by 10.6% (p<0.01). ACE-Is reduced the risk of new onset diabetes by 13.7% (p=0.012) Savarese G et al J Am Coll Cardiol 2013;61:131
Results – Subgroup analysis Savarese G et al J Am Coll Cardiol 2013;61:131
Conclusions • In comparison to placebo, ACE-Is substantially reduce the composite of CV death/MI/stroke as well as all-cause death, new onset HF and new onset DM in high-risk patients without HF, mostly with coronary or other vascular diseases. • ARBs, in high-risk patients mostly with DM or impaired glucose tolerance, without HF, reduce the composite outcome and new onset DM, but do not appear to reduce rates of all-cause death or new onset HF. Savarese G et al J Am Coll Cardiol 2013;61:131
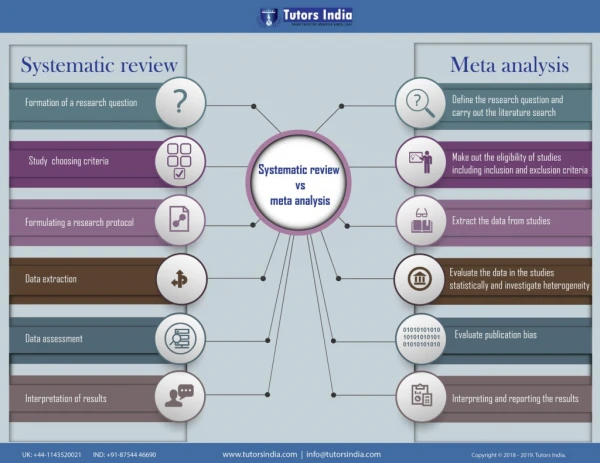
Systematic Review Meta-analysis Extract data from published reports (aggregated data meta-analysis) (Overview) Collect individual patient data (IPD) Types of Meta-analysis/Terminology Frequentist Approach Bayesian Approach Network