Download
1 / 23
230 likes | 462 Vues
Caesarean delivery and subsequent fetal death Systematic review and meta-analysis. Sinéad O Neill PhD student. Caesarean Sections (% of Total Live Births) 2000-2009. Source: European Health For All Database, WHO Regional Office for Europe, Copenhagen, Denmark.

E N D
Caesarean delivery and subsequent fetal death Systematic review and meta-analysis Sinéad O Neill PhD student
Caesarean Sections (% of Total Live Births) 2000-2009 Source: European Health For All Database, WHO Regional Office for Europe, Copenhagen, Denmark
National Institute for Health & Clinical Excellence (NICE) revised guidelines • Updated November 2011 • Evidence-based advice to women wishing to have a Caesarean delivery • NICE believe it will avoid “unnecessary” Caesareans, reduce the rates and dispel the myth “once a Caesarean, always a Caesarean” Source: CG132 Caesarean section: NICE guidelines, Nov 2011
The Media Spin….. “Women can choose Caesarean birth….even when there is no medical need!” [BBC NEWS] “Caesarean section on demand are madness” [Daily Mail] “Too posh to push? More C-sections on demand” [The Guardian]
Aim • To estimate the pooled risk of stillbirth and miscarriage in the subsequent delivery in women who had a previous Caesarean delivery, with women who had a previous vaginal delivery
Some figures…. • Stillbirth • In high-income countries, one in every 200 pregnant women reaching 22 weeks gestation will have a stillborn baby • Miscarriage • 20-25% of recognised pregnancies end in miscarriage
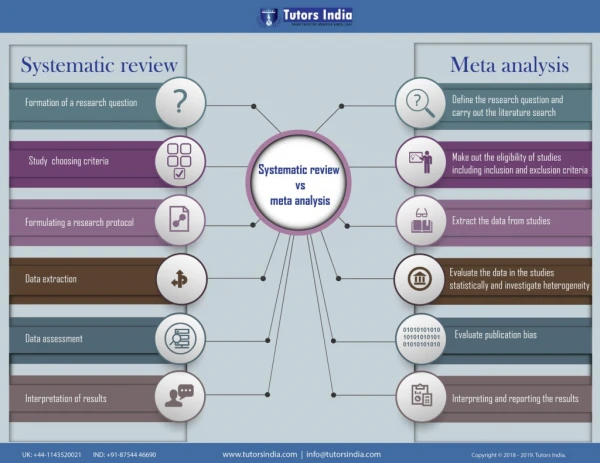
Study design and data sources • Systematic review (PRISMA guidelines) • Databases searched CINAHL, the Cochrane Library, Embase, Medline, PubMed, Scopus and Web of Knowledge • No date/language restrictions (1945-Nov 2011) • Comprehensive list of search terms, cross-checking of reference lists
Methods • Inclusion criteria • Cohort, cross-sectional,case-control • Exclusion criteria - RCTS, reviews, editorials, unpublished literature • Two reviewers; independent searches; standardised data collection form • Meta-analysis Review Manager version 5.1 software (Cochrane, 2011)
Risk of stillbirth (LogOR*) Study Weight Odds Ratio IV, Random, 95% CI Odds Ratio, 95% CI Franz 2009 9.1% Gray 2007 7.5% Kennare 2007 7.9% Ohana 2011 12.9% Reddy 2010 11.0% Richter 2007 8.3% Salihu 2006 12.8% Smith 2007 9.7% Taylor 2005 11.6% Wood 2008 9.2% Total (95% CI) 100.0% 1.30 [0.93, 1.81] 1.53 [1.00, 2.34] 1.56 [1.04, 2.33] 0.80 [0.71, 0.91] 1.30 [1.03, 1.64] 1.52 [1.05, 2.21] 1.10 [0.96, 1.25] 1.75 [1.30, 2.36] 1.10 [0.90, 1.35] 1.27 [0.92, 1.76] 1.25 [1.06, 1.49] * Adjusted for: maternal age, history of pregnancy loss, smoking, diabetes, SES, BMI, ethnicity
Sensitivity analysis (adj. OR) • Cohort studies (n=9) OR=1.28 95% CI 1.05, 1.56 • Cross-sectional (n=1) OR=1.10 95% CI 0.90, 1.35 • Primiparous (n=7) OR=1.29 95% CI 1.12, 1.49 • Multiparous (n=3) OR=1.13 95% CI 0.75, 1.72
Sensitivity analysis (adj. OR) Definition of stillbirth used: • All stillbirths (n=4) OR=1.15 95% CI 1.04, 1.27 • Unexplained (n=5) OR=1.47 95% CI 1.24, 1.74 • Antepartum (n=6) OR=1.27 95% CI 0.95, 1.70
Risk of miscarriage (crude OR) Study Weight Odds Ratio M-H, Fixed, 95% CI Odds Ratio, 95% CI Hall 1989 4.1% Hemminki 1985 1.3% Hemminki 1986a 2.9% Hemminki 1986b 5.3% Hemminki 1996 21.2% LaSala 1987 0.3% Mollison 2005 11.2% Smith 2006 52.2% Tower 2000 1.5% Total (95% CI) 100.0% 1.32 [1.06, 1.65] 1.10 [0.72, 1.69] 1.10 [0.82, 1.47] 1.12 [0.90, 1.38] 1.22 [1.10, 1.36] 1.26 [0.54, 2.92] 1.06 [0.92, 1.23] 1.07 [1.00, 1.15] 0.76 [0.48, 1.18] 1.11 [1.06, 1.17] *
Sensitivity analysis (crude OR) • Extra study added OR=1.12 95% CI 1.07, 1.17 • Cohort (n=7) OR=1.11 95% CI 1.06, 1.17 • Case-control (n=1) OR=1.26 95% CI 0.54, 2.92
Overall risk of fetal death (crude OR) Odds Ratio M-H, Random, 95% CI Odds Ratio, 95% CI Study Weight Franz 2009 7.2% Gray 2007 2.5% Kennare 2007 2.9% Ohana 2011 7.7% Olusanya 2009 4.1% Reddy 2010 5.0% Richter 2007 3.0% Salihu 2006 7.9% Smith 2007 4.9% Taylor 2005 5.7% Wood 2008 4.0% Subtotal (95% CI) 55.2% I2 =71% Hall 1989 5.2% Hemminki 1985 2.2% Hemminki 1986a 3.9% Hemminki 1986b 5.5% Hemminki 1996 8.5% LaSala 1987 0.7% Mollison 2005 7.2% Smith 2006 9.4% Tower 2000 2.1% Subtotal (95% CI) 44.8% I2 =20% Total (95% CI) 100.0% I2 =62% 1.00 [0.86, 1.16] 1.34 [0.90, 1.99] 1.43 [1.00, 2.06] 1.41 [1.24, 1.61] 1.04 [0.79, 1.37] 1.25 [0.99, 1.58] STILLBIRTH 1.35 [0.94, 1.93] 1.09 [0.96, 1.23] 1.97 [1.55, 2.49] 1.11 [0.91, 1.36] 1.32 [1.00, 1.76] 1.26 [1.12, 1.42] 1.32 [1.06, 1.65] 1.10 [0.72, 1.69] 1.10 [0.82, 1.47] 1.12 [0.90, 1.38] MISCARRIAGE 1.22 [1.10, 1.36] 1.26 [0.54, 2.92] 1.06 [0.92, 1.23] 1.07 [1.00, 1.15] 0.76 [0.48, 1.18] 1.12 [1.05, 1.20] 1.19 [ 1.11, 1.28] FETAL DEATH OVERALL
Conclusions • Women with a previous Caesarean delivery have an increased risk of: • Stillbirth by 25% • Miscarriage by 11% • Compared to women with a previous vaginal delivery • Residual confounding
Conclusions • Difficult to establish one unifying cause - Two very different pregnancy outcomes • Further research warranted - Population based, prospective - Universal definition and classification of outcomes recommended - Sub-analyses by type of Caesarean delivery (elective vs. emergency)
My PhD Research • Register-based cohort study • Danish Civil Registration System (CRS) data, unique identifiers, information rich • 800,000+ primiparous women giving birth between 1982 and 2010; Survival analysis • Research question: Is a primary Caesarean delivery associated with an increase in sub-fertility in subsequent pregnancies, compared with a primary vaginal delivery?” LINK: http://www.cpr.dk/cpr/site.aspx?p=198&ArticleTypeID=76.
Acknowledgements Prof. Louise Kenny, Dr. Patricia Kearney, Ms. Jennifer Lutomski, Prof. Richard Greene, Dr. Ali Khashan (University College Cork, Ireland), Prof. EsbenAgerbo and Dr. Tine Henriksen (Aarhus University, Denmark)


![[PDF] DOWNLOAD Wegovy For Weight Loss: Systematic Review and Meta-Analysis.](https://cdn7.slideserve.com/12504582/slide1-dt.jpg)