Download

1 / 8
80 likes | 280 Vues
Measures of Variation . Lesson 8 . Vocabulary. Measures of variation : used to describe the distribution of the data. Quartile: values that divide the data set into four equal parts. Upper Quartile : the median of the upper half of a set of data.

E N D
Measures of Variation Lesson 8
Vocabulary Measures of variation: used to describe the distribution of the data Quartile: values that divide the data set into four equal parts Upper Quartile: the median of the upper half of a set of data Lower Quartile: the median of the lower half of a set of data
Vocabulary Measures of variation: used to describe the distribution of the data Quartile: values that divide the data set into four equal parts Upper Quartile: the median of the upper half of a set of data Lower Quartile: the median of the lower half of a set of data
Vocabulary Range: the difference between the greatest and least data values. Interquartile Range: The range of the middle half of the data. It is the difference between the upper quartile and the lower quartile Outlier: a data value that is either much greater or much less than the median
Vocabulary Range: the difference between the greatest and least data values. Interquartile Range: The range of the middle half of the data. It is the difference between the upper quartile and the lower quartile Outlier: a data value that is either much greater or much less than the median Put that vocab to the test!
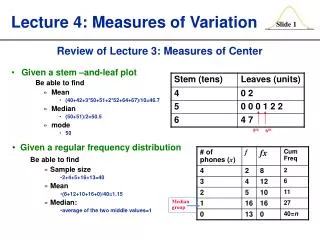
*List the numbers in order* 14, 18, 19, 20, 24, 29, 31 Lower quartile Upper quartile Median Interquartile Range: 29 – 18 = 11 Range: 31 – 14 = 17
Now Try These: 5, 8, 4, 4, 6, 3, 8 Interquartile Range= 8 – 4 = 4 Median= 5
1, 3, 3, 4, 5, 6, 6, 7, 8, 8 Interquartile Range= 7- 3 = 4 Median= 5 + 6 = 11 ÷ 2 = 5.5