Download

1 / 21
220 likes | 368 Vues
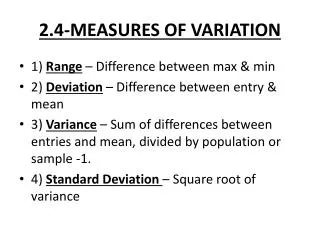
2.4: measures of variation. The range of a data set is the difference between the maximum and minimum data entries in the set. The find the range, the data must be quantitative. Range = (Maximum data entry) – (Minimum data entry). Range:.

E N D
The range of a data set is the difference between the maximum and minimum data entries in the set. The find the range, the data must be quantitative. Range = (Maximum data entry) – (Minimum data entry) Range:
Two corporations each hired 10 graduates. The starting salaries for each graduate are shown. Find the range of the starting salaries for corporation A and B. Starting Salaries for corporation A (1000s of dollars) Starting salaries for Corporation B (1000s of dollars) Ex 1:
Deviation: The deviation of an entry x in a population data set is the difference between the entry and the meanof the data set.Deviation of x = x -
Find the deviation of each starting salary for Corporation A. Ex 2:
In example 2, notice that the sum of the deviations is zero. Because this is true for any data set, it doesn’t make sense to find the average of the deviations. To overcome this problem, you can square each deviation. When you add the squares of the deviations, you compute a quantity called the sum of squares, denoted SSx. In a population data set, the mean of the squares of the deviations is called the population variance. Population Varianceof a population data set of N entries is Population variance= The symbol IS THE LOWERCASE GREEK LETTER SIGMA.
Of a population data set of N entries is the square root of the population variance. Population standard deviation = Population standard deviation
1. Find the mean of the population data set 2. find the deviation of each entry. 3. Square each deviation. 4. add the get the sum of squares. 5. Divide by N to get the population variance. 6. Find the square root of the variance to get the population standard deviation. Guidelines for finding the population variance and standard deviation
Find the population variance and standard deviation of the starting salaries for Corporation A given in ex1. Ex3:
Sample Variance and Sample Standard Deviation of a sample data set of n entries are listed below. Sample variance:Sample standard deviation = s
They are the same as the guidelines for finding the population variance and standard deviation but instead of the population you use the sample. Instead of dividing by N, in a sample you divide by n – 1, one less than the number of entries for technical reasons. Guidelines for finding the sample variance and standard deviation:
The starting salaries given in ex 1 are for the Chicago branches of Corporations A and B. Each corporation has several other branches, and you plan to use the starting salaries of the Chicago branches to estimate the starting salaries for the larger populations. Find the sample standard deviation of the starting salaries for the Chicago branch of Corporation A. Ex 4:
Remember that it is a measure of the typical amount an entry deviates from the mean. The more the entries are spread out, the greater the standard deviation. Interpreting Standard Deviation
Without calculating, estimate the population standard deviation of each data set. Ex6:
Many real-life data sets have distributions that are approximately symmetric and bell shaped. Empirical Rule: (68-95-99.7 Rule) For data with a symmetric bell-shaped distribution, the standard deviation has the following characteristics. About 68% of the data lie within one standard deviation of the mean. About 95% of the data lie within two standard deviations of the mean. About 99.7% of the data lie within three standard deviations of the mean. Bell Shaped Distribution and Empirical rule
In a survey conducted by the National Center for Health Statistics, the sample mean height of women in the United States (ages 20-29) was 64 inches, with a sample standard deviation of 2.71 inches. Estimate the percent of the women whose heights are between 64 inches and 69.42 inches. Ex7:
The portion of any data set lying within k standard deviations (k>1) of the mean is at least K = 2: In any data set, at least 75% of the data within 2 standard deviations of the mean. K=3: In any data lest, at least 88.9% of the data lie within 3 standard deviations of the mean. Chebychev’s Theorem: (for all distributions not symmetric)
The age distributions for Alaska and Florida are shown in the histograms. Decide which is which. Apply Chebychev’s Theorem to the data for Florida using k = 2. What can you conclude? Ex8:
Formula for the Sample standard deviation: Remember that formulas for grouped data require you to multiply by the frequencies. Standard Deviation for Grouped Data
You collect a random sample of the number of children per household in a region. The results are shown below. Find the sample mean and the sample standard deviation of the data set. Ex9:
The circle graph at the right shows the results of a survey in which 1000 adults were asked how much they spend in preparation for personal travel each year. Make a frequency distribution for the data. Then use the table to estimate the sample mean and the sample standard deviation of the data set. Ex10: