Download
1 / 20
210 likes | 407 Vues
CHS Statistics. 2.4: Measures of Center. Objective : To calculate and interpret measures of center given sets of data. 3 Types of Center Measurement. Mean Median Mode. 3 Types of Center Measurement. Mean

E N D
CHS Statistics 2.4: Measures of Center Objective: To calculate and interpret measures of center given sets of data
3 Types of Center Measurement • Mean • Median • Mode
3 Types of Center Measurement • Mean • Divide the sum of all datum and divide by the sample size (the number of data entries) • The mean is generally the most important/most utilized descriptive measurement.
3 Types of Center Measurement • Mean (continued) Ex)The prices (in dollars) for a sample of round trip flights from Chicago to Cancun are listed. What is the mean price of the flights? • 432 397 427388 • 782 397
3 Types of Center Measurement 2) Median • The middle value of the data set arranged in ascending (or descending) order. • If the number of values is odd, the median is the exact middle value. • If the number of values is even, the median is the mean of the two middle values. • Often denoted as
3 Types of Center Measurement 2) Median (continued) Example: The flight priced at $432 is no longer available. What is the median price of the remaining flights? 872 397 427 388 782 397
3 Types of Center Measurement 3) Mode • The value(s) in a set of data that occurs the most. • If no value is repeated, we say that is has no mode. However, one could argue that all values are modes…. • Example: Find the mode of the flight prices. 872 432 397 427 388 782 397
Outliers • A value that is much higher or lower than the mean. We will discuss the rule of thumb for identifying outliers at a later date. • Affect mean? • Affect median? BaoXishun 7 ft 9 inches He Pingping 2 ft 4 inches Robert Wadlow 8 Ft 11.1 inches
Outliers Example: The President of a company makes $100,000. His 6 computer Technicians make $30,000, $32,000, $35,000, $38,000, $38,000, and $42,000. His secretary makes $20,000 • What are the mean, median, and mode of these data? • What are the mean, median, and mode of these data, if the president’s salary is taken out?
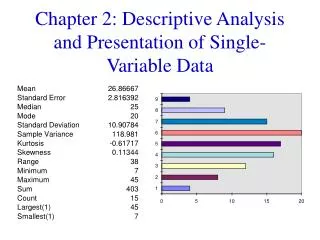
General Notes About Center Measures • When data are fairly symmetric, the mean and median tend to be about the same, but the mean is usually a better measure of center. • If the data are skewed, the median is the better measure of center.
What’s Your Height in Inches? • Input these data into L1 in your graphing calculator. • STAT Edit • Create a histogram of these data: • 2nd Statplot ON Select Histogram Select L1 for data in this case Frequency: 1 • Zoom 9: ZoomStat • Are these data skewed?
What’s Your Height in Inches? • Depending on the shape of the distribution, find an appropriate measure of center, mean or median: • With data still in your L1: • STAT Calc 1: One-Variable Stats
Day 1 Assignment: • pp. 65 – 66 # 2 – 8 EVEN
Day 2: Weighted Mean • A mean which is computed with different scores assigned for different weights. weighted
Weighted Mean You are taking a class in which your grade is determined from five categories: 50% from your test mean, 15% from your midterm, and 20% from your final exam, and 10% from your computer lab work, and 5% from your homework. Your scores are 86 (test mean), 96 (midterm), 82 (final exam), 98 (computer lab), and 100 (homework). What is the weighted mean of your scores? Did you earn an A?
Mean of a Frequency Distribution • Use the midpoints and counts to estimate the mean of the data. Why wouldn’t the mean be exact? Steps for Calculation: • Find the midpoints and frequencies • Multiply the midpoints and frequencies together. • Find the total of #2 (midpoint X frequency) • Find the total frequency • Divide #3 by #4 (see formula)
Mean of a Frequency Distribution • Example:
Mean of a Frequency Distribution • Use your calculator! • STAT Edit • Put midpoints into L1 • Put frequencies into L2 • STAT Calc 1-Variable Stats and enter L1 (2nd 1) , L2 (2nd 2)
Day 2 Assignment: • pp. 65 – 66 # 10, 20, 21