Download
1 / 1
10 likes | 173 Vues
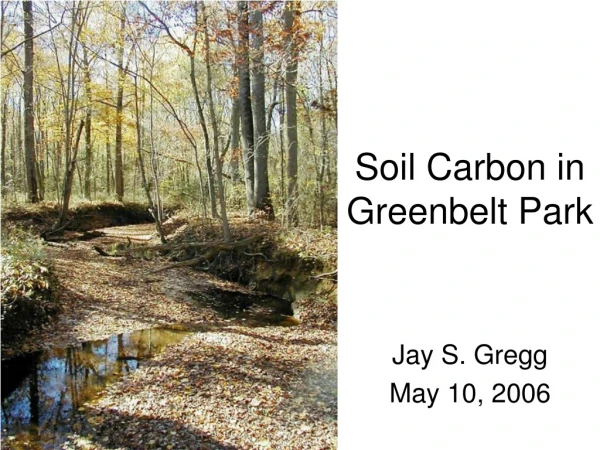
Soil Carbon and Phosphorous Fractions in Field Crop Rotations of the Argentine Pampas Ciampitti I.A. 123 , F.O. García 1 , G. Rubio 2 and L.I. Picone 4 1 IPNI Latin American Southern Cone, Argentina. 2 Facultad de Agronomía, UBA, Argentina.

E N D
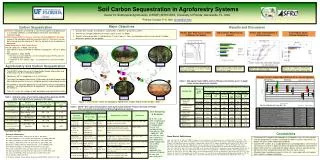
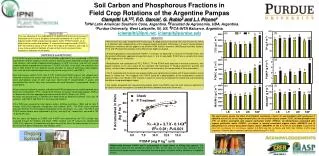
Soil Carbon and Phosphorous Fractions in Field Crop Rotations of the Argentine PampasCiampitti I.A.123, F.O. García1, G. Rubio2 and L.I. Picone4 1IPNI Latin American Southern Cone, Argentina. 2Facultad de Agronomía, UBA, Argentina. 3Purdue University, West Lafayette, IN, US. 4FCA-INTA Balcarce, Argentina. iciampitti@ipni.net, iciampit@purdue.edu OBJECTIVES The main objective of this study were to: (i) quantify the effects of continuous P fertilization on the size of the pools and vertical distribution of C and P in soil organic matter (SOM) and particulate organic matter (POM) fractions, (ii) to determine the relationship between P into particulate organic matter (POM-P) with the nutritional status of P for one of the crops of the rotations, corn crop, as a way to be a potential indicator of crop nutrition and (iii) evaluate these fractions as indicators of soil quality. RESULTS • Results from this study showed that the continuous P added practice increased TOC and TP contents after 6 yr in Mollisols soils, independently of the cropping system evaluated. Differences in C and P values between fertilization treatments did not appear to be only for POM fraction; moreover, MAOM pool and total fractions (TOC and TP) presented changes at the different soil depths evaluated. • Analyzing phosphorus associated with POM-P, in average, we observed an increase in fertilized P plots, and the greatest differences appeared at superficial layer, 0- to 5 cm soil depth. POM-P was a variable that shown a high response to P fertilization. • Redistribution and stratification of TOC, POM-C, TP and POM-P were observed in the both treatments, with greater contents at the soil surface for the treatment with continuous P. Residue placement, quantity and quality, and the slower decomposition may explain the increased in the accumulation of these parameters. • The P associated with the particulate organic matter was significantly correlated with P accumulated in maize plants at silking time. This suggests that POM-P could be a good predictor of the phosphorous nutritional status of crops, even though, more research is need it in reference to calibrate this relationship and monitoring the different crop phenological stages. • The carbon associated with the particulate organic matter and POM-P were the most sensitive indicators of soil quality and soil management, to detect differences between fertilization treatments. MATERIALS and METHODS • The CREA long term network, on-farm fertilization experiments, was established in 2000. This experimental network comprises eleven farmer´s field trials under stabilized no tillage and in two crop rotations: corn-double cropped wheat/soybeans (C-W/S; five sites), and corn-full season soybeans-double cropped wheat/soybeans (C-S-W/S; six sites). In our work, the evaluation year was in 2006, before the corn growing season and after six years of continuous crop rotations. Four trials were the selected experimental sites for the analysis of C and POM-P. • For total organic carbon (TOC), total P (TP), C-MOP and P-MOP analysis, soil samples were collected at silking time of corn crop and at 0-5 cm, 5-10 cm and 10-20 cm soil depths. At the same phonological stage of corn crop were determined P concentrations in plants and accumulated dry matter, from these parameters we could estimate P accumulated, uptake, in maize plants. • A conventional method to separate and obtaining POM are based on the modified procedure of Elliot and Cambardella (1991), changing the solution of sodium hexametaphosphate (NaPO3) for dispersion of the soil aggregates to sodium chloride (NaCl) (Salas et al., 2003). • Carbon and phosphorous in MAOM were determined by difference between TOC and TP contents, and POM-C and POM-P in the measured fractions. • The POM was analyzed for total organic carbon (Walkley and Black, 1934) and for total P through H2SO4/H2O2 digestion (Gasparatos and Haidouti, 2001). The POM values obtained were corrected for the mineralogical composition of the soil texture, silt + clay. The POM-C and POM-P concentrations were expressed in g C kg-1 and mg P kg-1, respectively, soil dried at 105 ºC during 24 hours. • In the same soil depths of C-MOP and P-MOP were determined, the TOC variable was analyzed through the Walkley and Black (1934) method, and TP analysis by concentrated H2SO4/H2O2 digestion, this procedure was done to verify the total P as determined by the sum of all measured P pools (Gasparatos and Haidouti, 2001). The figure above shows the effect of fertilization treatments, control (C) and situations with continuous P added to the soil (P), in four experimental sites, on the (a) total organic carbon (TOC), (b) total phosphorous (TP), (c) carbon associated with organic particulate matter (POM-C), (d) phosphorous associated with organic particulate matter (POM-P), (e) carbon in mineral associated organic matter (MAOM-C) and (f) phosphorous in mineral associated organic matter (MAOM-P), at the 0- to 20 cm soil depth. Experimental sites: LB, La Blanca; LH, La Hansa; rotation C-S-W/S and LM, La Marta and SAF, San Alfredo, C-W/S crop sequence. Different letters represent significant differences of P < 0.05. Cropping Systems Acknowledgements Relationship between POM-P and P accumulated in maize plants at silking time.(above). The dotted lines represent the confidence interval of 95% for the data set. Full circles represent the P treatment and empty squares are referred to the control plots, situations without continuous P added to the soil. Check P