Structural Changes -Color Images
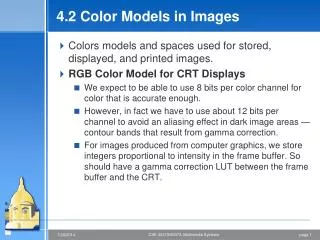
Absorption spectra of HbO 2 ( ) and Hb ( ). t i. t j. Modality k. Modality k. Modality m. Modality m. Image Understanding System. Image Understanding System. Registration . (Objects). IUS Assisted Image Correction . IUS Assisted Image Correction . (Corrected Images).
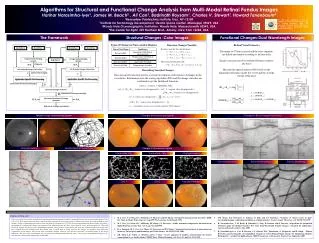

Structural Changes -Color Images
E N D
Presentation Transcript
Absorption spectra of HbO2 ( ) and Hb ( ) ti tj Modality k Modality k Modalitym Modality m Image Understanding System Image Understanding System Registration (Objects) IUS Assisted Image Correction IUS Assisted Image Correction (Corrected Images) Application Specific Pre-Processing Application Specific Pre-Processing (Corrected & Processed Images) Spectral Change Features (Features for change analysis) Structural/Functional Change Analyzer High level change descriptions Trace Mask –IUS1 Trace Mask – IUS2 Change Regions Day 2 Day 1 Vascular Changes Algorithms for Structural and Functional Change Analysis from Multi-Modal Retinal Fundus Images Harihar Narasimha-Iyer1, James M. Beach2 , Ali Can3, Badrinath Roysam1, Charles V. Stewart1, Howard Tanenbaum4 1Rensselaer Polytechnic Institute, Troy, NY-12180 2Institute for Technology Development, Stennis Space Center, Mississippi 39529, USA 3Woods Hole Oceanographic Institution, Woods Hole, Massachusetts 02543, USA. 4The Center for Sight, 349 Northern Blvd., Albany, New York 12204, USA. This work was supported in part by CenSSIS, the Center for Subsurface Sensing and Imaging Systems, under the Engineering Research Centers Program of the National Science Foundation (Award Number EEC-9986821) The Framework Structural Changes -Color Images Functional Changes-Dual Wavelength Images Types of Changes in Non-vascular Regions Retinal Vessel Oximetry Bayesian Change Classifier Features used for the classification: • The image at 570nm is traced and the trace segments are linked and named according to the hierarchy • Image correction involves median filtering to remove any noise • Measure the optical density (OD) based on the minimum reflectance inside the vessel and the average outside reflectance Bayesian classification rule: Describing Vascular Changes • Bayesian model selection used to associate descriptions with regions of changes in the vasculature. Information from the tracing algorithm (IUS) and the change classifier are combined to get the likelihood functions. Retinal Image Understanding System Changes in Nonvascular regions Changes in Blood Oxygen Saturation Changes in Nonvascular regions Vascular Linking Identification of Vessel Type Room Air Breathing Pure O2 Breathing OD Measurement State of the art • J.M. Beach, K.J. Schwenzer, S. Srinivas, D. Kim, and J.S. Tiedeman, “Oximetry of retinal vessels by dual-wavelength imaging: calibration and influence of pigmentation,” Journal of Appl. Physiology. vol. 86,748-758, 1999. • H. Narasimha-Iyer, J. M. Beach, B. Khoobehi, J. Ning, H. Kawano and B. Roysam, “Algorithms for Automated Oximetry along the Retinal Vascular Tree from Dual-Wavelength Fundus Images,” Accepted for publication, Journal of Biomedical Optics, May 2005. • H. Narasimha-Iyer, A. Can, B. Roysam, C.V. Stewart, H.L. Tanenbaum, A. Majerovics and H. Singh, " Robust Detection and Classification of Longitudinal Changes in Color Retinal Fundus Images for Monitoring Diabetic Retinopathy," Accepted for publication in IEEE Transactions on Biomedical Engineering, September 2005. • M. J. Cree, J.A. Olson, K.C. McHardy, J.V. Forrester and P.F. Sharp, “Automated microaneurysm detection,” IEEE Int. Conf. on Image Processing, vol. 3, pp.699-702, Lausanne, Switzerland, 1996. • M.J. Cree, J.A. Olson, K.C. McHardy, P.F. Sharp, J.V. Forrester, “A fully automated comparative microaneurysm digital detection system,” Eye, vol. 11, pp. 622-628,1998. • K.A. Goatman, M. J. Cree, J.A. Olson, J.V. Forrester and P.F. Sharp, “Automated measurement of microaneurysm turnover,” Investigative ophthalmology and Visual Science, vol.44,5335-5341, 2003. • Z.B. Sbeh, L.D. Cohen, G. Mimoun and G. Coscas, “A new approach of geodesic reconstruction for drusen segmentation in eye fundus images,” IEEE Trans. Medical. Imaging, vol. 20, no.12, pp.1321-1333, 2001. Only a few methods have been described for quantifying the dynamic nature of diabetic retinopathy from a time series of retinal images. Cree et al. [1, 2] detect microaneurysms from a region of interest around the fovea from images at distinct time points and compare them to find changes. Studies of microaneurysm turnover were also made by Goatman et al. [3]. They detected microaneurysms from baseline and follow-up angiograms, registered the images and categorized the microaneurysms into three classes namely, static, new and regressed. Sbeh and Cohen [4] segment drusen based on a morphological method called geodesic reconstruction and study the evolution of drusen over time..All these methods have the limitation that they handle only a certain kind of lesion and also the changes are obtained from individual segmentation of the images. The present work contributes multiple advances over the above literature, overcoming many of the noted limitations. The net result is an algorithm and a systematic non-limiting framework that allows a broad range of longitudinal changes to be detected and classified with a high degree of reliability.