Download
1 / 16
160 likes | 402 Vues
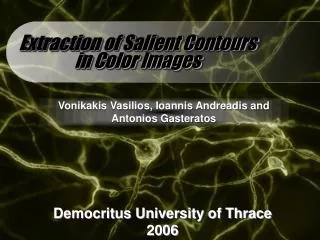
Color correction of pathological images. *Tokiya Abe ,Pinky A. Bautista, Yukako Yagi, John Gilbertson **Yuri Murakami, Masahiro Yamaguchi , Nagaaki Ohyama ***Hideaki Haneishi * Department of Pathology, Harvard Medical School

E N D
Color correction of pathological images *Tokiya Abe ,Pinky A. Bautista, Yukako Yagi, John Gilbertson **Yuri Murakami, Masahiro Yamaguchi , Nagaaki Ohyama ***Hideaki Haneishi * Department of Pathology, Harvard Medical School **Imaging Science & Engineering Laboratory, Tokyo Institute of Technology ***Research Center for Frontier Medical Engineering, Chiba University
Why the color of these images is different?Part 1 Imaging System A Imaging System B Imaging System C These images are generated from one H&E slide These differences are due to the different optical characteristic of the 3 imaging systems If a pathologist who is familiar with images of system A, but uses H&E image from system C, he has to calibrate the color of the image in his brain.
Why the color of these images is different?Part 2 Staining Condition A Staining Condition B Staining Condition C These images are generated from one imaging system These differences are due to different staining condition of 3 H&E slides If pathologist uses H&E image with staining condition C, It might be difficult for him to perform accurate diagnosis.
Digital Imaging in Pathology • Color variability in digital slide images can be stressful for pathologists performing diagnosis. • Therefore, color correction for digital slide images is important.
color correction based on 16-band imaging system • We have reported color correction of H&E stained images by using 16-band camera*. 16 bands multispectral microscope system Staining Condition A Staining Condition B (Digital Correction) This color correction method can digitally correct staining condition by adjusting dye amount. Although 16 band is ideal, but RGB imaging is widely used…. *T. Abe et al “Color Standardization of pathological images” in 2003 APIII
Objective Investigate the accuracy of color correction for H&E stained images using RGB with respect to 16-band.
Simulation of Color Correction for RGB H&E Stained tissue H&E stained tissue slide glass slide 16 bands Image Acquisition Spectral Estimation by Wiener estimation Simulation of RGB Image Generation of Spectral transmittance image Investigate the accuracy of color correction using different Wiener Matrices Correction of dye images Reconstruction of spectral transmittance image Decomposition to dye images Generation of color corrected image
Experiment • Single Wiener matrix for all H&E slides • Multiple Wiener matrices corresponding to different staining condition
G G R R B B Spectral Estimation by using Wiener Estimation Wiener Estimation Matrix Spectral transmittance Spectral transmittance Many types of spectral transmittance Wiener estimation matrix requires many types of spectral transmittance of H&E slide It is difficult to estimate spectral transmittance from RGB signal
H&E Stained Slides with different staining conditions Excess E Over Eosin staining time Normal Excess H Under Hematoxylin staining time Five slides of H&E stained liver specimens were prepared under different staining conditions Normal slide is stained optimally in hospital When “normal” is defined as target slide with optimal staining condition, the color of four slides are corrected into “normal”
Normal and Under stained slide Under (test) Normal (Target) The image labeled as under and normal correspond to tissue slide that are physically stained different staining time. By using color correction method, the color of under stained image can be corrected to have the color of the normal stained image.
Result Single Wiener Matrix Single Wiener Matrix Multiple Wiener Matrix RGB 16 bands (ideal) RGB Single Wiener matrix with RGB it is difficult to see that cytoplasm and RBC are stained with eosin. Because their color is not pink. Multiple Wiener matrix with RGB it is easy to see that cytoplasm and RBC are stained with eosin. The contrast among nucleus and RBC and cytoplasm is a lot better This result is closer to the ideal result generated from 16 band image
Accuracy of RGB color correction Single Wiener matrix Multiple Wiener Matrix Estimation of Spectral Transmittance Estimation of Amount of Dye Color Correction Color difference NRMSE of transmittance NRMSE of dye The 16-band result is the reference; Graphs represent the average difference between 16-band and RGB for all staining conditions
Conclusion • We investigated the accuracy of color correction for H&E stained images using RGB with respect to 16 band • With Wiener matrix corresponding to staining condition, the color corrected image by using RGB is close to that one by using 16 bands image in previous method Future Work • Automatically selection of Wiener matrix • Application of color correction method for Whole slide Image
Acknowledgment • We would like to thank CAP !!