Download
1 / 1
10 likes | 127 Vues
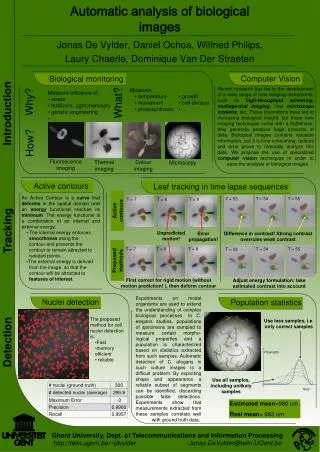
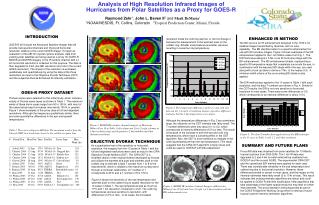
Analysis of High Resolution Infrared Images of Hurricanes from Polar Satellites as a Proxy for GOES-R. Raymond Zehr 1 , John L. Beven II 2 and Mark DeMaria 1 1 NOAA/NESDIS, Ft. Collins, Colorado 2 Tropical Prediction Center, Miami, Florida. INTRODUCTION. ENHANCED IR METHOD.

E N D
Analysis of High Resolution Infrared Images of Hurricanes from Polar Satellites as a Proxy for GOES-R Raymond Zehr1, John L. Beven II2 and Mark DeMaria1 1NOAA/NESDIS, Ft. Collins, Colorado 2Tropical Prediction Center, Miami, Florida INTRODUCTION ENHANCED IR METHOD resolution made the cold ring warmer, or did not change it because the measurement is the warmest pixel on the coldest ring. Smaller scale features are better resolved, resulting in a warmer ring temperature. The BD curve is an IR enhancement designed in the 1970's, for satellite images transmitted by facsimile, with no color capability. The BD identifier refers to a specific enhancement for use with IR hurricane images. Figure 3 shows examples of the DB enhancement applied to the 1 km Wilma cases from Fig. 1. The EIR Technique assigns a T-No. to an IR hurricane image with the BD enhancement. The BD enhancement shade, representing a specific IR temperature range that completely surrounds the eye, in combination with the warmest BD shade within the eye, are used along with a look-up table to derive a T-No. to the nearest 0.5. A minimum width criteria of the surrounding BD shade is also applied. The EIR method was applied to the 13 cases in Table 1 with each resolution, and the data T numbers are shown in Fig. 4. Similar to the ODT results, the EIR is not very sensitive to horizontal resolution in most cases. There were some differences of 0.5, which corresponds to an intensity difference of about 10 kt. GOES-R will include the Advanced Baseline Imager that will provide new spectral channels and improved horizontal resolution relative to the current GOES imager. To begin an evaluation of the ABI for tropical cyclone analysis, data from existing polar satellites are being used as a proxy for GOES-R. MODIS and AVHRR imagery in the IR window channel with a 1 km horizontal resolution is collected for this purpose. The data is then degraded to 2 km (the ABI resolution) and 4 km (the current GOES resolution). The impact of the resolution is evaluated qualitatively and quantitatively by using the data at the three resolutions as input to the Objective Dvorak Technique (ODT) and the subjective Dvorak Enhanced IR intensity estimation. GOES-R PROXY DATASET Thirteen cases were selected for this initial study, which include a variety of Dvorak scene types as shown in Table 1. The maximum winds of these storm cases range from 50 to 150 kt, with most of the cases being major hurricanes (max winds 100 kt or greater). Figure 1 show examples of the proxy data at full and degraded resolutions. Although the images are qualitatively similar, there are some quantitative differences in the eye and eyewall temperatures. Figure 2. The temperature differences of the eye and cold ring between the 1-2 and 1-4 resolution images. A positive difference indicates that the 1 km temperature was warmer. Although the temperature differences in Fig. 2 are sometimes large, the influence on the ODT intensity was fairly small. The T number differences were only about 0.1 to 0.2, which corresponds to intensity differences of 5 kt or less. This result is because of the increase in both the eye and cold ring temperatures, which have a canceling effect in the ODT algorithm. Also, the ODT is more sensitive to changes in the cold ring temperature than the eye temperature. This result suggests that the CIRA ODT algorithm is fairly robust and could be used for GOES-R with little adjustment. Figure 1. MODIS IR (window channel) imagery of Hurricane Wilma (Case 10 in Table 1 left column and Case 11 right column) at 1 km resolution (top) and degraded to 2 km (middle) and 4 km (bottom) resolution. • Table 1. The cases with proxy ABI data. The maximum wind is from the • 6 hourly NHC best track time closest to the satellite overpass time. • __________________________________________________________ • # Storm/Year Mon/Day Time Satellite Scene Type Max • Wind (kt) • __________________________________________________________ • Isabel 2003 11 Sep 1735 NOAA-16 Eye 145 • 2. Charley 2004 13 Aug 0754 NOAA-16 Ragged Eye 105 • 3. Charley 2004 13 Aug 1628 NOAA-17 Pinhole Eye 125 • 4. Charley 2004 13 Aug 1911 NOAA-16 Pinhole eye 125 • 5. Gaston 2004 28 Aug 1545 NOAA-17 Curved band 50 • 6. Arlene 2005 10 Jun 1910 AQUA Shear 55 • 7. Dennis 2005 08 Jul 0700 AQUA Ragged eye 110 • Katrina 2005 26 Aug 0325 TERRA Embedded center 65 • 9. Rita 2005 21 Sep 1610 TERRA Eye 145 • 10. Wilma 2005 19 Oct 0710 AQUA Pinhole eye 150 • 11. Wilma 2005 20 Oct 1845 AQUA Eye/ragged eye 130 • 12. Wilma 2005 21 Oct 1930 AQUA Eye 120 • 13. Beta 2005 30 Oct 0339 NOAA-17 Eye/pinhole eye 100 • ___________________________________________________________ Figure 4.. The data T number from application of the EIR technique to the 13 cases in Table 1 with 1, 2 and 4 km resolution. OBJECTIVE DVORAK TECHNIQUE SUMMARY AND FUTURE PLANS As a quantitative test of the sensitivity to horizontal resolution, the imagery from the 13 cases in Table 1 with the full and degraded resolutions were used as input to the CIRA Objective Dvorak Method (ODT). The CIRA ODT is a modified version of the original method developed by Dvorak, and utilizes the warmest eye pixel and warmest pixel on the coldest ring to estimate a data T number from 1 to 8 to the nearest tenth, which is related to the maximum surface wind through a nonlinear relationship. A T number of 1 corresponds to 25 kt and a T number of 8 is 170 kt. Proxy ABI data was obtained from polar satellites for 13 Atlantic tropical cyclones from 2003-2005. The 1 km IR data was degraded to 2 and 4 km to match what will be available from GOES-R and the current GOES. The experimental CIRA ODT and the operational EIR method were applied for each case. There was considerable variability in the eye temperature and coldest ring due to horizontal resolution. However, these differences tended to cancel in most cases, and the impact on the intensity estimates were fairly small (5 to 10 kt or less). This result indicates that existing intensity algorithms are robust and could be applied to GOES-R with little modification. New algorithms that take advantage of the higher spatial resolution may lead to further improvements. The proxy dataset is being expanded as part of the GOES-R Algorithm Working Group effort for testing of future tropical cyclone intensity estimation algorithms. Figure 2 shows the sensitivity of the eye temperature and warmest pixel on the coldest ring to spatial resolution for the 13 cases in Table 1. The eye temperature was as much as 11oC with 1 km resolution compared to 4 km. The cold ring temperatures are less sensitive to resolution, with differences of 2oC or less. In all cases, the increased Figure 3. MODIS IR (window channel) Imagery of Hurricane Wilma (Case 10 left and Case 11 right ) at 1 km resolution with the BD enhancement curve.