Download

1 / 55
550 likes | 750 Vues
High-resolution mapping and analysis of the human regulatory genome. John Stamatoyannopoulos , M.D. Depts. of Genome Sciences & Medicine University of Washington. Genes, regulatory DNA, and epigenetic features. Genes, regulatory DNA, and epigenetic features. promoters enhancers

E N D
High-resolution mapping and analysis of the human regulatory genome John Stamatoyannopoulos, M.D. Depts. of Genome Sciences & Medicine University of Washington
Genes, regulatory DNA, and epigenetic features • promoters • enhancers • - silencers • insulators • etc.
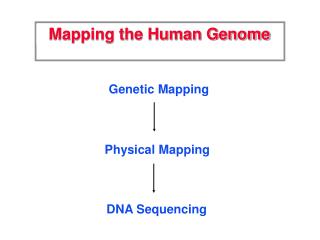
Overview Part I: Mapping the human cis-regulatory landscape Part II: Footprinting the human genome
Genes, regulatory DNA, and epigenetic features DNaseI • promoters • enhancers • - silencers • insulators • etc.
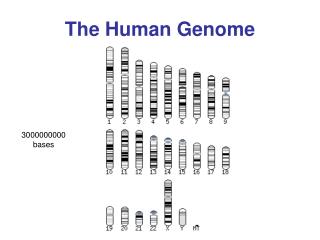
DNaseI hypersensitive sites mark regulatory DNA Promoters DNaseI Hypersensitive site (DHS) Enhancers ~100,000 – 250,000 DHSs per cell type (0.5-1.5% of genome) genome.ucsc.eduwww.epigenomebrowser.org
Mapping the human cis-regulatory landscape
Creating publicly available atlases of human regulatory DNA genome.ucsc.eduwww.roadmapepigenomics.org
A global atlas of human regulatory DNA – overview • >250 cell types, tissues, and developmental stages • Model cell lines, Primary cells in culture • Ex vivo hematopoietic cells, Fetal tissues (late 1st – late 2nd trimester) • ~100,000 - >250,000 DHSs per cell type (0.5-1.5% of genome) • Collectively >3 million distinct elements • ~800,000 cell type-specific, ~3,500 constitutive • Comprehensive annotation of known regulatory DNA • 99% of experimentally-validated enhancers, silencers, • insulators, locus control regions
DNaseI accessibility parallels cumulative transcription factor occupancy
DHSs reflect the cumulative action of transcription factor binding
DHSs reflect the cumulative action of transcription factor binding
DHSs reflect the cumulative action of transcription factor binding
DHSs mark a rich regulatory landscape Regulatory effects of CpG methylation De novo promoter identification Cell-selective regulatory selection
Footprinting the Human Genome
DNaseI hypersensitive sites mark regulatory DNA DNaseI Hypersensitive site (DHS)
A direct and quantitative measure of TF occupancy
Footprinting is a quantitative measure of in vivo factor occupancy
Footprinting is a quantitative measure of in vivo factor occupancy
TF structure is imprinted on the human genome
TFs show distinct, stereotyped DNaseI cleavage patterns NF1 ~10,000 motif instances in DHSs (unsorted)
The footprint of transcription initiation
TF recognition sequences within the footprinted initiation zone Motifs within footprint
The footprint of transcription initiation +1 Buratowski et al. Cell, 1989
An expansive cis-regulatory lexicon encoded in TF footprints