Download
1 / 24
240 likes | 328 Vues
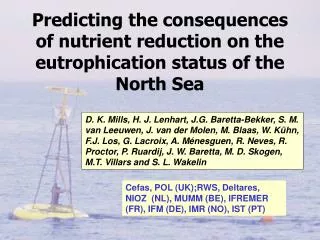
Learn about resources needed to combat sea pollution, prevention strategies, and incident risks in the Dutch North Sea. Explore pollution sources, oil traffic data, ecological vulnerability, and financial implications. Findings include potential collisions, oil spill frequency, and ecological advice for contingency planning.

E N D
Status of risk analysis in the Dutch part of the North Sea Henk Offringa Rijkswaterstaat National Institute for Coastal and Marine Management
Note ‘To protect vulnerable marine and estuarine areas’ ‘Capacity note 2006 – 2010’ (issued 2006) Indicates the extent of resources needed to combat pollution due to calamities at sea Based on risk analysis
Pollution sources Risk = chance * effect Prevention Required resources for incidents Risk analyses
Sources of pollution • Incidental discharges from: shipping, offshore installations, under water pipelines, harbour activities, aeroplane accidents and installations on shore; • Shipping >>>>> offshore installations, under water pipelines, harbour activities, aeroplane accidents and installations on shore; • Crude oil >>>>> Heavy Fuel Oil (HFO) and chemical substances
Top 10 of crude oils unloaded in Rotterdam Name OriginVolume (Mton) 2000 Arabian Light Saudi Arabia 9,22 Russian Export Blend Russia 6,59 Oseberg Norway 5,87 Kuwait Export Kuwait 5,33 Kirkük Iraq 4,23 Gullfaks Norway 3,80 Forties Great Britain 3,70 Arabian Extra Light Saudi Arabia 2,84 Arabian Medium Saudi Arabia 2,67 Alba Great Britain 2,25 2004 4,41 11,45 3,1 1,32 1,58 1,4 0,9 Σ ~ 100 Mton
Traffic density, routes and transport of substances Human health Logistic and practical aspects Risk on incidents ~ frequency and nature Economical valuable objects and areas Ecological vulnerability Risk on spills ~ frequency and nature finances Risk = chance effect
Cargo data Lloyds database Port A Arrival date IMO-number Type of oil Amount of oil Type of activity Arrival port A Arrival date Previous/next port (B) IMO-number Ship type/size Transport routes, approach
Example: result Rotterdam (crude) • Almost all import • Main origin: • 40% Dover strait • 30% Northern part of the North Sea • 24% Baltic
<500 kton 500 – 1000 kton 1000 – 2500 kton 2500 – 5000 kton 5000 – 7500 kton 7500 – 10000 kton > 10000 kton Amount of crude oil to Rotterdam
<50 kton 50 – 100 kton 100 – 250 kton 250 – 500 kton 500 – 750 kton 750 – 1000 kton > 1000 kton Amount of HFO to Rotterdam
Conclusion transport • Quality is reasonable acceptable, but little is known on the exact routes • Passing ships is not discernible with this method • Preliminary: shift in transport routes through Baltic
Further work: chance on collision and spills • Created traffic databases are used within the SAMSON-model (Safety Assessment Model for Shipping and Offshore on the North Sea). Samson is run by MARIN • Determine the frequency of an oil spill and the expected size of the oil spill. • Report 2004, data 2000, update not available yet
Potential number of collisions between ships (regardless their cargo, year 2000)
Potential frequency of an oil spill as a result of any accident at sea (year 2000)
Maximum amount of spilled oil that is expected to occur at least once every 10,000 year(based on traffic data year 2000)
Ecological advice in operational contingency planning dimension time advice 1 minute ½ hour 1 hour 3 hours 3 days 3 weeks/months Immediate Look up Discuss with colleagues Call external experts Monitoring / evaluation
Scenario: medium crude oil (example) Dilemma Based on 34 species
Do we need more sophisticated and detailed maps? How do we value species in and outside SPA’s and SACs Do we need harmonisation of existing maps? Dilemma’s