Download
1 / 26
270 likes | 636 Vues
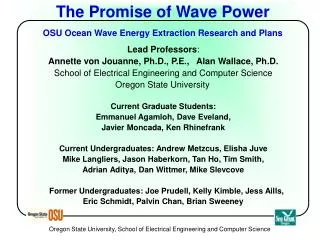
The Promise of Wave Power OSU Ocean Wave Energy Research and Plans. Lead Professors : Annette von Jouanne, Alan Wallace, Ted Brekken School of Electrical Engineering and Computer Science Oregon State University Excellent Multidisciplinary group of Graduate Students

E N D
The Promise of Wave PowerOSU Ocean Wave Energy Research and Plans Lead Professors: Annette von Jouanne, Alan Wallace, Ted Brekken School of Electrical Engineering and Computer Science Oregon State University Excellent Multidisciplinary group of Graduate Students Three Current Undergraduate Senior Design Teams Port Liaison Project (PLP) Partnership Team Newport Wave Energy Team
OSU’s multidisciplinary wave energy team is pursuing Wave Energy innovation in three thrust areas:1) Researching novel direct-drive wave energy generators2) Developing an action plan for a National Wave Energy Research and Demonstration Center in Oregon (Goal)-Essential for the U.S. to be a leader in wave energy-Currently very little investment by Federal Government/DOE compared to the rest of the world 3) Working closely with the Oregon Department of Energy (ODOE) and a variety of stakeholders to promote Oregon as the optimal location for the nation’s first commercial wave parks.
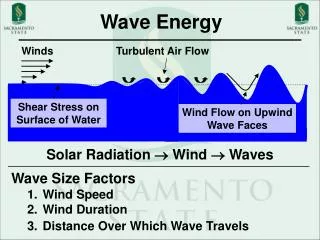
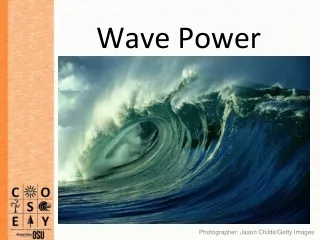
Waves Waves are a concentrated form of solar energy Technology to convert wave energy to electrical energy is in its beginning phase > 1000 Patents < 2 MW Installed Active Gov’t RD&D Program in Europe and Australia No Gov’t RD&D Program in the U.S. Demonstration in the U.S. is the Next Needed Step in the Technology Development Process
New forms of Energy are required ! Introduction • It is estimated that if 0.2% of the ocean’s untapped energy could be harnessed, it could provide power sufficient for the entire world. Compared to Other Renewables, Wave Energy Advantages: Higher energy density, availability (80 – 90%) and predictability • OSU is an Excellent Location to conduct ocean wave energy extraction research: • Motor Systems Resource Facility (MSRF) • O.H. Hinsdale Wave Research Lab • Hatfield Marine Science Center • Wave energy potentials of the Oregon coast.
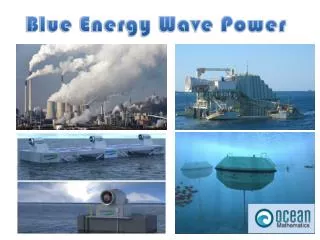
Oscillating Water Column Wave Energy Extraction Technologies Point Absorber Overtopping Attenuator
OSU Strategic Facilities to Advance Wave Energy Motor Systems Resource Facility (MSRF) O.H. Hinsdale Wave Research Lab (HWRL)
OSU – Key Location for Ocean Wave Energy Research • 750 KVA Adjustable Power Supply • Variable Voltage input(0-600Vac), 600A • 3-phase adjustable (while loaded) for balanced and unbalanced testing • Highest Power University Lab in the Nation • Enables Multi-Scale energy research • Four Quadrant Dynamometer • Programmable torque/speed • Dynamic Vector Controls 0-4000 rpm • Bidirectional Grid Interface • Regeneration back to the utility grid • Flexible, 300 hp,Motor/Generator test-bed • 120KVA programmable source • Transient VLrms=680V • Steady State VLrms= 530V • Frequency range: 45Hz to 2KHz Motor Systems Resource Facility (MSRF)
OSU – Key Location for Ocean Wave Energy Research • O.H. Hinsdale Wave Research Lab (HWRL) • Dimensions:342ft long,12ft wide, 15ft deep • Wave period range: 0.5 to 10 seconds • Max. Wave: 1.6 m (5.2 ft) @ 3.5 sec
Power from Ocean WavesAvailable Resource off Oregon Coast NDBC Data Buoys CDIP (SCRIPPS) Data Buoys • Wave Energy Resource Assessment Study carried out for Oregon Coast • (See Oregon Sea Grant Report “Conversion of Wave Characteristics to Actual Electric Energy/Power Potentials”, January 2004) • Long term average data over 10 years analyzed • Report confirmed that Oregon has some of the richest ocean wave energy • extraction sites in the world
Power from Ocean WavesAvailable Resource off Oregon Coast Data buoys are 2-200mi off shore, with waves traveling 15-20mph, gives 10+ hours forecast time for buoy generators located 2 mi out Seasonal variation – Good match for the NW load demand (wave data From National Data Buoy Center, Power estimated from 5 buoys off the Oregon coast over past 10 years) Power from a wave is W/m of crest length (distance along an individual crest) = the density of sea water = 1025 kg/m3 g = acceleration due to gravity = 9.8 m/s2 T = period of wave (s) (averages 8s in the winter to 6s in the summer) H = wave height (m) (averages 3.5m in the winter to 1.5m in the summer)
Potential Wave Energy Impact on Oregon (Load Data Provided by PGE) Oregon 2004 Est. Avg Consumption Generation West of Cascades: 3,511MW (69%) 2,509MW (28%) (1002MW deficit) East of Cascades: 1,606MW (31%) 6,515MW (72%) Total: 5,117MW 9,024MW From the previous slide (Winter avg is 50kW/m, Summer avg is 10kW/m), Considering an overall average of 30kW/m and an Oregon coastline of 460km, the total Oregon coast “raw” Wave Energy potential is in the range of 13,800MW In Perspective Seven sites have been identified by EPRI study, with the potential to expand to 100MW (estimated that three sites could be fully licensed within seven years) Oregon goal for 25% renewables by 2025 (this goal could be 50% satisfied by wave energy based on current consumption)
EPRI Study: Seven Oregon Sites • Astoria • Garibaldi INSERT OREGON MAP ‘Wave Park’ Sites Identified by EPRI Study • Newport • Cushman • Reedsport • Coos Bay • Brookings
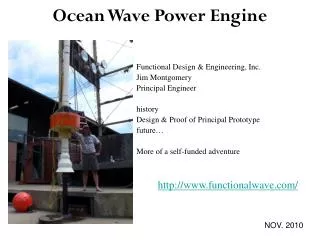
Direct Drive Buoys (Current Technology Focus) Generators respond directly to the movement of the ocean by employing magnetic fields for contact-less mechanical energy transmission, and power electronics for efficient electrical energy extraction “Direct-Drive” describes the direct coupling of the buoy’s velocity and force to the generator without the use of hydraulic fluid or air. Simplify and Advance existing buoy technologies Avoid additional stages such as hydraulic and pneumatic based units Pursue optimum topologies OSU’s Devices and Goals Devices Must beSurvivable, Reliable, and Maintainablewith efficient and high quality power take-off systems
OSU’s Novel Direct Drive Buoy Approaches Permanent Magnet Linear Generator Contactless Force Transmission (eliminates “working seals”) Permanent Magnet Rack and Pinion Drive (Licensing through Columbia Power Technologies)
Wave Energy Exhibit for the HMSC Transverse Flux Permanent Magnet Linear Generator
Research Includes Advanced Modeling Techniques Fluid to Moving Structure Interaction(coupled fluid-structure interaction) Buoys heaving in waves, using Finite Volume Computational Fluid Dynamics Solver (COMET) (Finite Element/Volume Mesh Analysis)
Wave Energy Park Environmental Monitoring Protocol Development Effects of Electromagnetic Fields: Sea bird attraction? Marine Mammal attraction, repulsion. Changes in whale migration pathways. Change in larval dispersion. Change in fish use of area, change in fish migration, change in fish reproductive success. Shark attraction. Effects from construction/deployment/service of cables The most destructive aspect of laying natural gas lines is during the deployment of lines; the seafloor with its inhabitants are altered as the line is laid with large machinery. Similar effects could be expected with lying of electric cables if similar methods are used. Impact on invertebrates or seafloor structure from placement of anchors and power lines. Creation of a sediment plume and resulting impacts on fish/invertebrates. Effects of the physical structure of the buoy field. Entanglement of marine mammals: whales, dolphins. Effects of using antifouling agents: introduction of toxics. Creation of a new community: Does the new structure act as a filter for larval dispersal so that recruitment in surrounding areas is decreased? Will the structure create a new habitat that will facilitate recruit and production of marine organisms? Monitoring needs to be scale appropriate. Impacts from small scale may not be scaleable to large energy generation farms. Monitoring program needs to be adaptive in design to respond to evolving impacts Monitoring needs to compare manipulated and un-manipulated areas.
Oregon Wave Energy Industry Collaboration Wave Energy OPAC (Ocean Policy Adv. Council) BPA NREL (USDOE) OR Econ. & Comm. Dev. Industry PNGC NOAA Governors Office Hatfield Marine Sci. Ctr. Developer PacifiCorp USACE Legal State Legislators OR DLCD Fabricators CLPUD Coast Guard Com’l Fishing & Crabbing OR State Lands Operations Maintenance PGE FERC Recreation / Marine Concerns OR State Marine Board Quality Control
Oregon’s Competitive Advantage • Unique ocean resource • Established marine community • Excellent reputation for renewable energy and green industry support • Positive political climate (both state & federal) “Oregon is poised to lead the nation and the world in wave energy research, development and production. We have the wave resource, the expertise through collaboration including tremendous university, industry, utility and community support, and the utility infrastructure along the coast to deliver this clean, renewable power into the grid.” For More info on Wave Energy: DVD from Oregon Sea Grant


![[TIDAL WAVE AND OCEAN CURRENT ENERGY PRODUCTION]](https://cdn1.slideserve.com/1590527/tidal-wave-and-ocean-current-energy-production-dt.jpg)