Download
1 / 27
270 likes | 394 Vues
This document outlines the development of specialized software for modeling and analyzing mixing zones—specific regions in water bodies where wastewater dilution occurs. It details the tools and sensors used, including CTD (Conductivity, Temperature, Depth) sensors and DGPS for location data. The project involved creating an efficient data processing application in C++/CLI, significantly improving data handling and analysis speed. It also highlights collaboration with field studies and contributions to redesigning MixZon's intranet for better usability.

E N D
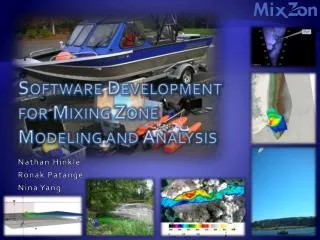
Software Development for Mixing Zone Modeling and Analysis Nathan Hinkle Ronak Patangé Nina Yang
What Is a Mixing Zone? • Mixing Zones (n): • Mixing zones are limited regions in rivers, lakes and coastal areas where the initial dilution (dispersion) of point-source wastewater discharges occur
Who MixZon Is What the company does and where we fit in
CORMIX Licensing Consulting Technical Support Mixing Zone Field Studies
Sensors • CTD • Conductivity, Temperature, Depth • Used to find plumes • ADCP • Acoustic Doppler Current Profiler • Uses sonar to determine water velocities • DGPS • Differential Global Positioning System • Provides sub-meter location data Source: rdinstruments
Illustration: Nathan Hinkle Differential GPS Station broadcasts offset between known coordinates and satellite coordinates. Location ±15m from satellites
FLIR • Forward Looking InfraRed • Uses infrared to measure spot temperatures Source: mixzon.com
FLIR FLIR system on a telescoping mast FLIR system on a tethered balloon
Jet Boat Commercial Processing Software Internally developed software Photos: mixzon.com
Raft Riverboat Sensors WiFi Bridge WiFi Access Point Laptop GPS Commercial processing tools Internally developed processing tools Source: mixzon.com
Data Post-processing Application Development Data processing with custom applications to replace manual spreadsheet labor Nathan Hinkle
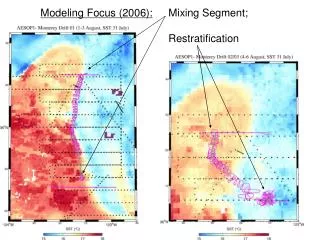
CTD Data Collection: • CTD = Conductivity, Temperature, Depth sensor • Used to find plumes and determine mixing zones • Data collected as text files Photo: mixzon.com
CTD – Depth casts: • Sensor is dropped in • Downcast • …then pulled up • Upcast • We only want upcast data • We only want the data points for the maximum values
CTD Processing – Previously: • Data saved as raw text • Interns and employees manually find upcast • Maximum values manually found • Slow, inefficient
CTD Processing – Solution: • Designed an algorithm • Wrote an application to implement algorithm • Used C++/CLI programming language
CTD Processing – Solution: • Output as smaller text files • Output to GIS shapefile • GPS coordinates make points • Attribute data attached to coordinate points • Maps can be created from these points
User can select multiple files Output is shown while processing Maximum values are shown with lines and in text Status strip shows sensor information Graph is shown for each of the measurements User can select which file’s graph to look at
Other Projects • Helped with field data collection
Other Projects • Redesigned MixZon’s intranet site • New UI • Platform-independent, w3c-compliant code • Used PHP, HTML, CSS
Skills Learned • Microsoft C++/CLI • New programming language • Mixing zone terminology • Understanding of GPS/GIS • Environmental science in the field • Experiencing a professional work situation
Other Interns’ Projects • Other interns’ sections of the ppt have been redacted
Thank You! Thank you to all of the people who made our internships such a great experience: • Dr. Robert Doneker – MixZon’s President • Our mentors • Adi Ramachandran • Dr. Todd Sanders • Frank Opila • Kent Thompson • Thomas “Legacy” Lovett • The ASE staff