Download
1 / 1
30 likes | 231 Vues
Statistical approaches to outliers in bioassay data Kelly Fleetwood 1 , Catriona Keerie 1 , Ann Yellowlees 1 , Karie Hirst 2 , Robin Sun 2 , Peter Fusco 2 1 . Quantics Consulting, Edinburgh, UK; 2. PharmAthene Inc , Annapolis , Maryland, USA. Conclusions. Introduction.

E N D
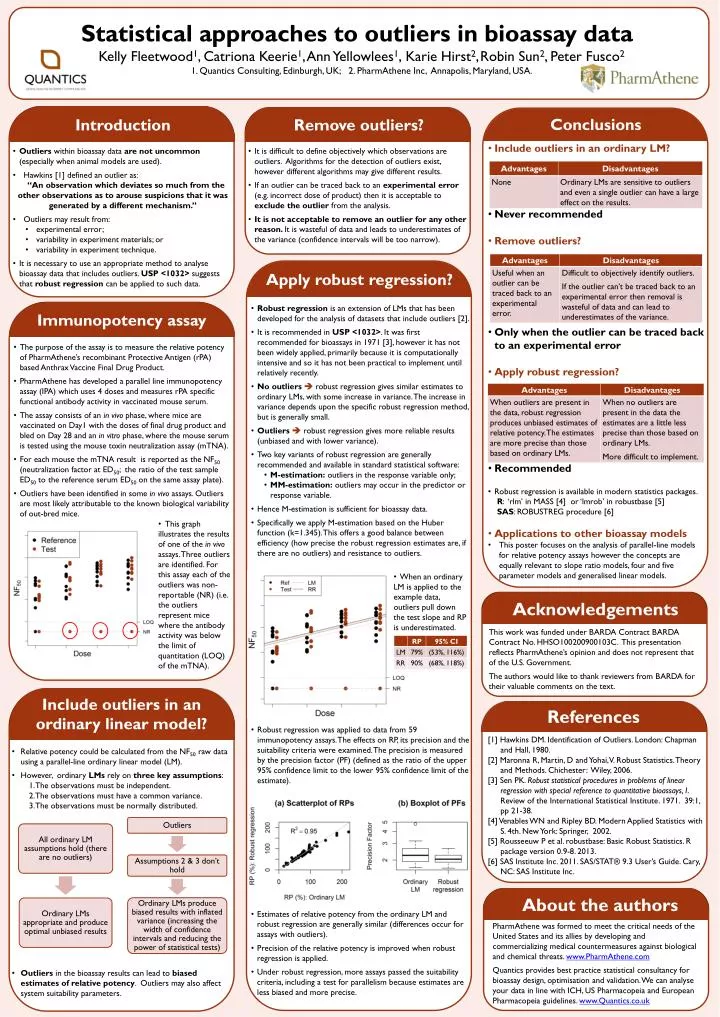
Statistical approaches to outliers in bioassay data • Kelly Fleetwood1, Catriona Keerie1, Ann Yellowlees1,Karie Hirst2,Robin Sun2, Peter Fusco2 • 1. Quantics Consulting, Edinburgh, UK; 2. PharmAthene Inc, Annapolis, Maryland, USA. Conclusions Introduction Remove outliers? • Include outliers in an ordinary LM? • Never recommended • Remove outliers? • Only when the outlier can be traced back to an experimental error • Apply robust regression? • Recommended • Robust regression is available in modern statistics packages. • R: ‘rlm’ in MASS [4] or ‘lmrob’ in robustbase [5] • SAS: ROBUSTREG procedure [6] • Applications to other bioassay models • This poster focuses on the analysis of parallel-line models for relative potency assays however the concepts are equally relevant to slope ratio models, four and five parameter models and generalised linear models. • Outliers within bioassay data are not uncommon • (especially when animal models are used). • Hawkins [1] defined an outlier as: • “An observation which deviates so much from the other observations as to arouse suspicions that it was generated by a different mechanism.” • Outliers may result from: • experimental error; • variability in experiment materials; or • variability in experiment technique. • It is necessary to use an appropriate method to analyse bioassay data that includes outliers.USP <1032> suggests that robust regression can be applied to such data. • It is difficult to define objectively which observations are outliers. Algorithms for the detection of outliers exist, however different algorithms may give different results. • If an outlier can be traced back to an experimental error (e.g. incorrect dose of product) then it is acceptable to exclude the outlier from the analysis. • It is not acceptable to remove an outlier for any other reason. It is wasteful of data and leads to underestimates of the variance (confidence intervals will be too narrow). Apply robust regression? • Robust regression is an extension of LMs that has been developed for the analysis of datasets that include outliers [2]. • It is recommended in USP <1032>. It was first recommended for bioassays in 1971[3], however it has not been widely applied, primarily because it is computationally intensive and so it has not been practical to implement until relatively recently. • No outliers robust regression gives similar estimates to ordinary LMs, with some increase in variance. The increase in variance depends upon the specific robust regression method, but is generally small. • Outliers robust regression gives more reliable results (unbiased and with lower variance). • Two key variants of robust regression are generally recommended and available in standard statistical software: • M-estimation: outliers in the response variable only; • MM-estimation: outliers may occur in the predictor or response variable. • Hence M-estimation is sufficient for bioassay data. • Specifically we apply M-estimation based on the Huber function (k=1.345). This offers a good balance between efficiency (how precise the robust regression estimates are, if there are no outliers) and resistance to outliers. • Robust regression was applied to data from 59 immunopotency assays. The effects on RP, its precision and the suitability criteria were examined. The precision is measured by the precision factor (PF) (defined as the ratio of the upper 95% confidence limit to the lower 95% confidence limit of the estimate). • Estimates of relative potency from the ordinary LM and robust regression are generally similar (differences occur for assays with outliers). • Precision of the relative potency is improved when robust regression is applied. • Under robust regression, more assays passed the suitability criteria, including a test for parallelism because estimates are less biased and more precise. Immunopotency assay • The purpose of the assay is to measure the relative potency of PharmAthene’s recombinant Protective Antigen (rPA) based Anthrax Vaccine Final Drug Product. • PharmAthene has developed a parallel line immunopotency assay (IPA) which uses 4 doses and measures rPA specific functional antibody activity in vaccinated mouse serum. • The assay consists of an in vivo phase, where mice are vaccinated on Day1 with the doses of final drug product and bled on Day 28 and an in vitro phase, where the mouse serum is tested using the mouse toxin neutralization assay (mTNA). • For each mousethe mTNA result is reported as the NF50 (neutralization factor at ED50; the ratio of the test sample ED50 to the reference serum ED50on the same assay plate). • Outliers have been identified in some in vivo assays. Outliers are most likely attributable to the known biological variability of out-bred mice. • This graph illustrates the results of one of the in vivo assays. Three outliers are identified. For this assay each of the outliers was non-reportable (NR) (i.e. the outliers represent mice where the antibody activity was below the limit of quantitation (LOQ) of the mTNA). • When an ordinary LM is applied to the example data, outliers pull down the test slope and RP is underestimated. Acknowledgements This work was funded under BARDA Contract BARDA Contract No. HHSO100200900103C. This presentation reflects PharmAthene’s opinion and does not represent that of the U.S. Government. The authors would like to thank reviewers from BARDA for their valuable comments on the text. Include outliers in an ordinary linear model? References [1] Hawkins DM. Identification of Outliers. London: Chapman and Hall, 1980. [2] MaronnaR, Martin, D and Yohai, V. Robust Statistics. Theory and Methods. Chichester: Wiley, 2006. [3] Sen PK. Robust statistical procedures in problems of linear regression with special reference to quantitative bioassays, I. Review of the International Statistical Institute. 1971. 39:1, pp 21-38. [4] Venables WN and Ripley BD. Modern Applied Statistics with S. 4th. New York: Springer, 2002. [5] Rousseeuw Pet al. robustbase: Basic Robust Statistics. R package version 0.9-8. 2013. [6] SAS Institute Inc. 2011. SAS/STAT® 9.3 User’s Guide. Cary, NC: SAS Institute Inc. • Relative potency could be calculated from the NF50 raw data using a parallel-line ordinary linear model (LM). • However, ordinary LMsrely on three key assumptions: • 1.The observations must be independent. • 2.The observations must have a common variance. • 3.The observations must be normally distributed. • Outliersin the bioassay results can lead to biased estimates of relative potency. Outliers may also affect system suitability parameters. About the authors PharmAthene was formed to meet the critical needs of the United States and its allies by developing and commercializing medical countermeasures against biological and chemical threats. www.PharmAthene.com Quantics provides best practice statistical consultancy for bioassay design, optimisation and validation. We can analyse your data in line with ICH, US Pharmacopeia and European Pharmacopeia guidelines. www.Quantics.co.uk